Calumo for Microsoft Dynamics 365: Reporting, Budgeting, Forecasting and FP&A Solutions

Brydens BI helps Microsoft Dynamics 365 finance teams extend their ERP environment with Calumo for stronger management reporting, project reporting, budgeting, rolling forecasting, dashboards and FP&A.

We take an active, hands-on role in every engagement. Rather than simply integrating systems and expecting finance teams to work through the data themselves, we collaborate with CFOs, finance leaders and reporting teams to create Calumo solutions that are practical, well-supported and tailored to the business’s real reporting, planning and decision-making processes.

Brydens BI has delivered Calumo solutions for organisations using Microsoft Dynamics 365, including Standards Australia and Geocon. These projects show how D365 data can be extended into a broader finance performance management environment covering reporting, planning, forecasting and analytics.

For many businesses, D365 Finance & Operations sits at the centre of ERP and transactional processing. Calumo complements this by surrounding D365 with a controlled reporting and planning framework, allowing finance teams to integrate financial, project, workforce, operational, budgeting, forecast and executive reporting data into one consistent environment. It helps that Calumo is also Microsoft-centric

Why D365 Finance Teams Look Beyond ERP Reporting

Microsoft Dynamics 365 Finance & Operations provides strong ERP capability across finance, projects, procurement, operations and enterprise processes. For many finance teams, however, the next stage of maturity is not simply more transactional reporting. It is better visibility, better planning and better decision support.

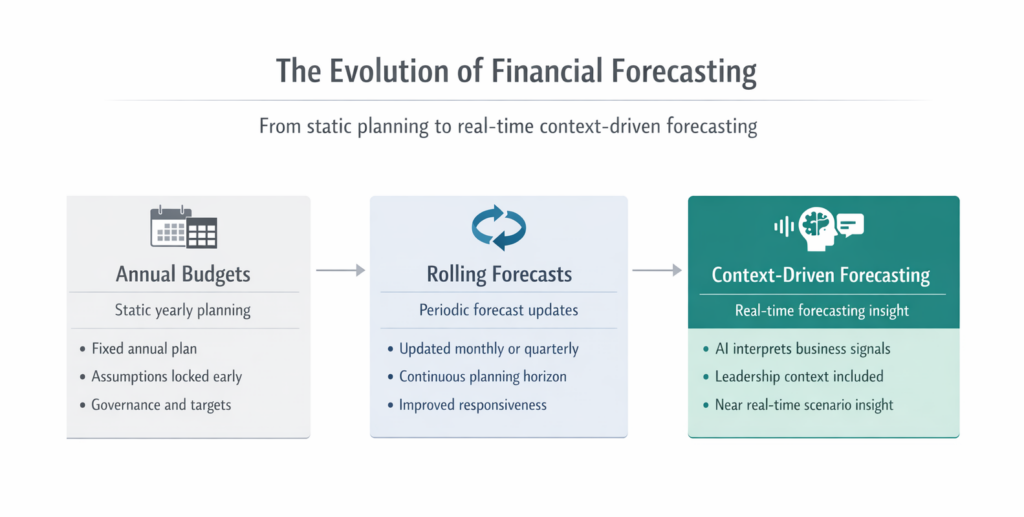
As organisations grow, finance teams often need faster management reporting, board and executive packs, project-level budgeting, rolling forecasts, scenario modelling, dashboards, workforce and employee cost allocation, and more controlled Excel-enabled processes that finance users can trust.

They also need confidence that the numbers reconcile, the mappings are controlled, and the reporting logic is repeatable from month to month.

That is difficult to sustain when key reporting and planning processes depend on disconnected spreadsheets, manual exports and one-off adjustments.

Calumo helps by giving D365 finance teams a structured performance management layer. It allows finance users to keep working in familiar Excel-based reporting and planning environments where appropriate, while improving governance, consistency and control over the underlying data.

Practical Calumo and Microsoft Dynamics 365 Experience

Brydens BI has hands-on experience delivering Calumo solutions for organisations using Microsoft Dynamics 365. These projects often extend beyond the general ledger, combining D365 with HR, CRM, project, data warehouse or operational systems to create a more complete finance reporting and planning environment.

Standards Australia: D365, Employment Hero and Rolling Forecasting

Standards Australia implemented Calumo to modernise and streamline its management reporting framework, introduce rolling forecasting, and support detailed project-level budgeting with integrated employee cost allocation.

The solution was initially connected to Microsoft GP. It has since been upgraded to integrate via API with D365 Finance & Operations, Employment Hero and the organisation’s internal data warehouse with information flowing in both directions.

This strengthened automation, data accuracy and financial oversight while preserving the broader Calumo planning and reporting environment. For finance teams moving from legacy finance systems into D365, this is an important point. A well-designed Calumo environment can adapt as underlying systems change.

Geocon: D365, Salesforce and Employment Hero

Geocon has used Calumo and been supported by Brydens BI for many years.

Information from Dynamics F&O general ledger and projects, along with Salesforce and Employment Hero, is automatically populated into Geocon’s Calumo Data Warehouse on both periodic and on-demand refresh cycles.

Calumo is used across management reporting, dashboarding, budgeting and rolling forecasts. As Geocon’s underlying systems have changed over time, Calumo has adapted, continuing to provide a stable finance reporting and planning layer around the organisation’s data.

These examples show that the value is not just connecting D365 to Calumo. The real value comes from building a governed finance layer that combines D365 with the other systems finance teams need to understand performance properly. Being able to generate reports and dashboards or undertake adhoc analysis that effortlessly uses data from the General Leger, Projects Module, Salesforce, and HR unlocks significant value.

What a Calumo and D365 Solution Can Deliver

A successful Calumo and Microsoft Dynamics 365 solution is not just a technical integration. The value comes from designing the finance model properly.

Brydens BI works with finance teams to understand the reporting structures, planning cycles, project reporting requirements, consolidation needs, business rules and management outputs that matter. From there, we build a solution that can support day-to-day finance operations and continue to improve over time.

Depending on the client, this may include:

  • D365 integration into Calumo and a governed Finance Data Warehouse
  • General ledger, transaction-level, project and job-level reporting
  • Board, executive and monthly finance reporting packs
  • Budgeting, rolling forecasting and scenario modelling
  • Workforce, employee cost allocation and project planning support
  • HR, CRM, operational or internal data warehouse integration
  • Excel-enabled reporting and planning with stronger governance
  • Ongoing support, enhancement and finance-team enablement

The aim is not to replace D365. Microsoft Dynamics 365 remains the ERP and transactional system of record. Calumo provides the finance-owned layer for reporting, planning, forecasting and FP&A.

From D365 Reporting to Broader FP&A

Many D365 clients begin with a reporting problem.

Month-end reporting takes too long. Project reporting is difficult to maintain. Forecasting is disconnected from actuals. Board reporting depends on spreadsheets that are hard to control. Different teams may have different versions of the numbers.

Once D365 data is connected into a governed Calumo model, finance teams can start to address those issues in a more structured way.

Actuals, budgets, forecasts, mappings, hierarchies and reporting logic can be brought together into one environment. That creates a stronger foundation for monthly management reporting, board reporting, project-level reporting, annual budgeting, driver-based rolling forecasts, scenario analysis, workforce planning, cost allocation, dashboarding and operational KPI analysis.

The real benefit is not simply faster reports. It is a better finance operating model. Finance teams spend less time assembling numbers and more time explaining performance, testing assumptions and supporting better business decisions.

Combining D365 with Other Business Systems

One of the strongest use cases for Calumo is bringing D365 data together with other business systems.

In many organisations, D365 is not the only system finance teams care about. HR, payroll, CRM, project, operational and data warehouse sources often contain information needed for reporting and planning.

Brydens BI has delivered Calumo environments that combine D365 data with information from systems such as Employment Hero, Salesforce and internal data warehouses. This gives finance teams a broader reporting view across the business, rather than being limited to the ERP alone. Where appropriate, finance-approved data from Calumo can also be written back to the internal data warehouse, supporting a controlled flow of information between finance and the wider data environment.

Rather than forcing all analysis to happen directly inside the ERP, Brydens BI designs a finance-ready data foundation that can combine D365 with the other datasets finance needs. Calumo then sits on top of that foundation to support reporting, consolidation, budgeting, forecasting and analysis.

This gives finance a single, governed environment for decision support while still allowing operational systems to do what they do best.

Why the Data Model Matters

One of the most important parts of any D365 and Calumo project is the data model.

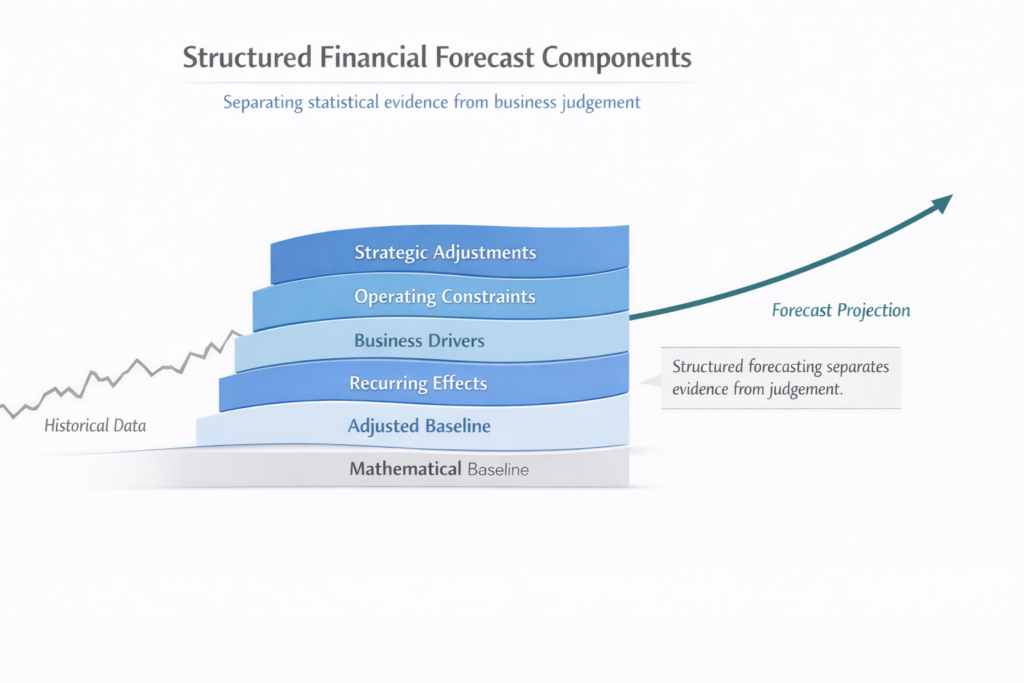
A connector can move data from D365 into another environment, but it does not automatically create useful management reporting, forecasting or decision support. Finance teams need the data structured around how the business is actually managed.

That can include entity structures, management account mappings, project and job views, workforce cost allocation, reporting hierarchies, forecast versions, scenario assumptions, internal data warehouse inputs and controlled manual adjustments.

Brydens BI focuses on this design work because it is where many reporting and planning projects succeed or fail. A good Calumo model should be technically reliable, but also practical for finance users to maintain, review and explain.

Supporting D365 Clients Over Time

Finance reporting and planning requirements rarely stay still.

A business may add entities, change reporting structures, introduce new project or job reporting, acquire another business, refine its forecast process or add new systems such as HR, CRM, operational or project platforms.

For that reason, Brydens BI places significant emphasis on ongoing relationships. We often continue working with finance teams after the initial implementation to support month-end reporting, improve existing models, add new reporting views, refine forecasting logic, extend dashboards and help internal users become more self-sufficient.

This ongoing relationship is important because Calumo is most valuable when it evolves with the finance function. The first release may solve the immediate reporting or planning problem, but the platform can then be extended into broader analytics, forecasting and FP&A capability.

Calumo for D365 During System Change

Calumo can be especially useful during periods of finance systems change.

When an organisation moves from a legacy system into D365, the ERP implementation is usually only one part of the finance transformation. Management reporting, project reporting, budgets, rolling forecasts and executive packs still need to keep operating during and after the transition.

A Calumo layer can help preserve continuity by separating core reporting and planning logic from the source ERP. As long as the data is mapped and governed properly, finance teams can maintain familiar reporting outputs while the underlying system landscape changes.

This was an important part of the Standards Australia story. Calumo was initially connected to Microsoft GP and later upgraded to integrate with D365 Finance & Operations, Employment Hero and the organisation’s internal data warehouse, while preserving the broader planning and reporting environment.

For growing and changing organisations, this flexibility can be valuable. It allows finance teams to modernise systems without losing control of the reporting and planning processes that senior management relies on.

Greenfield Calumo and D365 Projects

For organisations starting fresh with Microsoft Dynamics 365 and Calumo, Brydens BI would typically begin with the highest-value finance outcomes.

That often means connecting D365 financial and project data into Calumo, validating actuals, building core reporting hierarchies, designing project or employee cost allocation logic, creating management reports and establishing the first budgeting or rolling forecast model.

From there, the solution can be expanded into dashboards, operational reporting, workforce planning, project-level analysis, cash flow forecasting, scenario modelling and broader FP&A.

A practical implementation should balance speed and governance. Finance teams need useful outputs quickly, but the underlying design must be robust enough to support future growth.

Why Brydens BI Is a Strong Fit for D365 Finance Teams

Brydens BI combines hands-on Calumo delivery experience with finance-led data architecture and practical CFO-level understanding.

That combination matters. A successful D365 and Calumo project requires more than technical integration. It requires a clear understanding of finance processes, reporting cycles, planning requirements, project reporting, governance, controls and the way finance teams actually work.

Our work is hands-on and relationship-led. We help clients design the model, build the solution, validate the outputs, train finance users and continue improving the environment after go-live.

For D365 clients, Brydens BI brings:

  • Practical Calumo implementation experience
  • Experience integrating Calumo with D365 Finance & Operations
  • Finance Data Warehouse design on Microsoft Azure
  • Management reporting and FP&A capability
  • Budgeting, forecasting and scenario modelling experience
  • Multi-system finance integration experience
  • Ongoing support beyond the initial implementation

The result is a Calumo solution that is not just technically connected to D365, but genuinely useful to the finance team.

Learn more about our approach to Calumo implementation and support.

Related Calumo and ERP Reporting Solutions

Brydens BI also supports reporting, budgeting, forecasting, dashboards, process automation and FP&A solutions across other finance systems, operational platforms and data sources.

Common Microsoft Dynamics 365 and Calumo Questions

Can Calumo integrate with Microsoft Dynamics 365 Finance & Operations?

Yes. Brydens BI has delivered Calumo solutions that integrate with D365 Finance & Operations, including API-based integration patterns for finance and related data.

Why use Calumo if we already have D365?

D365 remains the ERP and transactional system of record. Calumo provides an extended reporting, planning, forecasting, dashboarding and FP&A layer around it. This is especially useful when finance needs more flexible reporting, scenario modelling, Excel interaction, workflow, or integration with non-financial systems.

Can Calumo support budgeting and forecasting around D365?

Yes. Once D365 data is available in a governed finance data foundation, Calumo can support budgeting, rolling forecasts, scenario modelling, workflow governance and broader FP&A capability.

Can Calumo combine D365 with other systems?

Yes. Many finance reporting requirements require more than ERP data. Calumo can combine D365 with payroll, HR, CRM, project, operational and data warehouse sources to support integrated reporting and planning.

Can Calumo support project-level reporting and budgeting?

Yes. D365 project data can be combined with finance, workforce and operational data to support more detailed project reporting, employee cost allocation, budget monitoring and rolling forecasts.

Can we keep using Excel?

Yes. Calumo supports Excel-enabled reporting and analysis while maintaining a governed central data model. This gives finance users flexibility without returning to disconnected spreadsheet processes.

Does Calumo replace D365?

No. D365 remains the transactional system of record. Calumo extends D365 by providing a finance performance management layer for reporting, planning, forecasting, dashboards and governed Excel-enabled analysis.

Is this only relevant for large organisations?

No. The value depends less on size and more on finance complexity. Organisations with project reporting, multiple systems, rolling forecasts, board reporting, employee cost allocation or complex management reporting can benefit from a governed Calumo layer around D365.

A Practical Next Step for D365 Finance Teams

For D365 finance teams looking to improve management reporting, project reporting, budgeting, rolling forecasting or broader FP&A capability, Brydens BI can help design and support a practical Calumo solution around your Microsoft Dynamics 365 environment.

Because Brydens BI has delivered Calumo solutions for D365 clients such as Standards Australia and Geocon, future clients can benefit from a more informed starting point, proven hands-on experience and an ongoing relationship focused on continuous improvement.

Talk to Brydens BI about Microsoft Dynamics 365 reporting, budgeting, forecasting and FP&A with Calumo.

Calumo for Sage Intacct: Reporting, Budgeting, Forecasting and FP&A Solutions

Brydens BI helps Sage Intacct finance teams extend their ERP environment with Calumo for stronger management reporting, consolidation, budgeting, forecasting and FP&A.

Our work is hands-on. We do not simply connect systems and leave finance teams to make sense of the data. We work closely with CFOs, finance leaders and internal reporting teams to design, build, support and improve practical Calumo solutions that reflect how the business actually reports, plans and makes decisions.

Brydens BI has delivered Calumo solutions for organisations using Sage Intacct, including Acumentis, Energy One and ALAND. These projects show how Calumo can help Sage Intacct clients move beyond standard ERP reporting into a more flexible, finance-owned performance management environment.

For many organisations, Sage Intacct is the core financial management system. Calumo complements Sage Intacct by providing a governed reporting and planning layer around the ERP, allowing finance teams to combine actuals, budgets, forecasts, management structures, operational data and executive reporting requirements in one controlled environment.

Why Sage Intacct Finance Teams Look Beyond ERP Reporting

Sage Intacct provides strong cloud financial management capability, especially for organisations with multiple entities, growing operations or more complex finance requirements. For many CFOs and finance teams, however, the ERP is only one part of the broader finance architecture.

As businesses grow, reporting and planning requirements usually become more complex. Finance teams need to produce board-ready management reports faster, combine Sage Intacct data with HR, CRM, project, contract or operational data, support rolling forecasts, automate consolidations and give executives clearer insight without creating more manual work for finance.

They also need confidence that the numbers reconcile, the mappings are controlled, and the reporting logic is repeatable from month to month.

That is difficult to sustain when key reporting and planning processes depend on disconnected spreadsheets, manual exports and one-off adjustments.

Calumo helps by giving Sage Intacct finance teams a structured performance management layer. It allows finance users to keep working in familiar Excel-based reporting and planning environments where appropriate, while improving governance, consistency and control over the underlying data.

Practical Calumo and Sage Intacct Experience

Brydens BI has hands-on experience delivering Calumo solutions for organisations using Sage Intacct. These projects often extend beyond the general ledger to include other Sage modules, as well as external systems such as HR, CRM and relevant operational platforms. This creates a more complete finance reporting and planning environment. Calumo also supports consolidation and multi-currency reporting, helping remove a common pain point for finance teams.

Acumentis: Sage Intacct, Employment Hero and Operational Reporting

For Acumentis, Brydens BI linked Calumo to Sage Intacct, Employment Hero and the organisation’s internal valuation system to enable reporting, three-way rolling forecasts, commission calculations and detailed employee-level reporting.

This gave the finance team a stronger platform for combining Sage Intacct financial data with employee, valuation and operational information, while supporting more detailed forecasting and reporting processes.

ALAND: Consolidation Across CHEOPS and Sage Intacct

For ALAND, Brydens BI brought together financial data from CHEOPS and Sage Intacct into Calumo to support real-time consolidation, ad hoc analysis, reconciliation, intercompany reconciliation and reporting.

This type of solution is valuable where finance reporting needs to bring together multiple systems, entities and reporting structures into one governed environment.

Energy One: Sage Intacct, HiBob and HubSpot

For Energy One, Brydens BI automated reporting from Sage Intacct and HiBob for GL, HR and contract data, while also connecting HubSpot CRM to show on-demand pipeline and deal status across geographic regions.

This shows how Sage Intacct reporting can be extended beyond finance data alone, giving finance and executive teams a broader view of financial, people, contract and pipeline performance.

These examples show that the value is not just connecting Sage Intacct to Calumo. The real value comes from building a governed finance layer that combines Sage Intacct with the other systems finance teams need to understand performance properly.

What a Calumo and Sage Intacct Solution Can Deliver

A successful Calumo and Sage Intacct solution is not just a technical integration. The value comes from designing the finance model properly.

Brydens BI works with finance teams to understand the reporting structures, planning cycles, consolidation requirements, business rules and management outputs that matter. From there, we build a solution that can support day-to-day finance operations and continue to improve over time.

Depending on the client, this may include:

  • Sage Intacct integration into Calumo and a governed Finance Data Warehouse
  • General ledger, transaction-level and multi-entity reporting
  • Consolidation, intercompany reporting and reconciliation support
  • Board, executive and monthly finance reporting packs
  • Budgeting, rolling forecasting and scenario modelling
  • HR, CRM, project, contract or operational data integration
  • Excel-enabled reporting and planning with stronger governance
  • Ongoing support, enhancement and finance-team enablement

The aim is not to replace Sage Intacct. Sage Intacct remains the core financial management system. Calumo provides the finance-owned layer for reporting, planning, forecasting and FP&A.

From Sage Intacct Reporting to Broader FP&A

Many Sage Intacct clients begin with a reporting problem.

Month-end reporting takes too long. Budget-to-actual analysis is too manual. Forecasting is disconnected from actuals. Board reporting depends on spreadsheets that are hard to maintain. Different teams may have different versions of the numbers.

Once Sage Intacct data is connected into a governed Calumo model, finance teams can start to address those issues in a more structured way.

Actuals, budgets, forecasts, mappings, hierarchies and reporting logic can be brought together into one environment. That creates a stronger foundation for monthly management reporting, board reporting, multi-entity consolidation, annual budgeting, rolling forecasts, driver-based planning, scenario analysis, workforce and cost planning, revenue and contract reporting, commission calculations and operational KPI analysis.

The real benefit is not simply faster reports. It is a better finance operating model. Finance teams spend less time assembling numbers and more time explaining performance, testing assumptions and supporting better business decisions.

Combining Sage Intacct with Non-Financial Data

One of the strongest use cases for Calumo is bringing Sage Intacct data together with other business systems.

In many organisations, the general ledger does not contain all the information required for performance management. Finance may also need data from HR and payroll systems, CRM platforms, project systems, contract management systems, operational databases, internal industry-specific systems, Excel models and controlled manual inputs.

This is where a Finance Data Warehouse becomes critical.

Rather than forcing all analysis to happen directly inside the ERP, Brydens BI designs a finance-ready data foundation that can combine Sage Intacct with the other datasets finance needs. Calumo then sits on top of that foundation to support reporting, consolidation, budgeting, forecasting and analysis.

This gives finance a single, governed environment for decision support while still allowing operational systems to do what they do best.

Why the Data Model Matters

One of the most important parts of any Sage Intacct and Calumo project is the data model.

A connector can move data from Sage Intacct into another environment, but it does not automatically create useful management reporting, forecasting or decision support. Finance teams need the data structured around how the business is actually managed.

That can include entity structures, management account mappings, project or contract views, employee-level reporting, commission logic, intercompany relationships, forecast versions, reporting hierarchies and controlled manual inputs.

Brydens BI focuses on this design work because it is where many reporting and planning projects succeed or fail. A good Calumo model should be technically reliable, but also practical for finance users to maintain, review and explain.

Supporting Sage Intacct Clients Over Time

Finance reporting and planning requirements rarely stay still.

A business may add entities, change reporting structures, introduce new project or contract reporting, acquire another business, refine its forecast process or add new systems such as HR, CRM or operational platforms.

For that reason, Brydens BI places significant emphasis on ongoing relationships. We often continue working with finance teams after the initial implementation to support month-end reporting, improve existing models, add new reporting views, refine forecasting logic, extend dashboards and help internal users become more self-sufficient.

This ongoing relationship is important because Calumo is most valuable when it evolves with the finance function. The first release may solve the immediate reporting or consolidation problem, but the platform can then be extended into broader planning, analytics and FP&A capability.

Calumo for Sage Intacct During Growth and System Complexity

Calumo can be especially useful when a business has outgrown simple reporting structures or when Sage Intacct is only one part of a broader systems landscape.

Growing organisations often add new entities, expand into new regions, introduce new project or contract structures, change reporting lines or bring in additional platforms for HR, CRM, operations or industry-specific processes.

A Calumo layer can help preserve consistency by separating core reporting and planning logic from any single source system. As long as the data is mapped and governed properly, finance teams can maintain familiar reporting outputs while the underlying business and systems landscape changes.

This matters because finance transformation is rarely a single event. Reporting, budgeting, forecasting and executive decision support need to keep operating as the organisation changes.

Greenfield Calumo and Sage Intacct Projects

For organisations starting fresh with Sage Intacct and Calumo, Brydens BI would typically begin with the highest-value finance outcomes.

That often means connecting Sage Intacct financial data into Calumo, validating actuals, building core reporting hierarchies, designing consolidation or intercompany logic, creating management reports and establishing the first budgeting or forecasting model.

From there, the solution can be expanded into dashboards, operational reporting, workforce planning, contract reporting, commission calculations, cash flow forecasting, scenario modelling and broader FP&A.

A practical implementation should balance speed and governance. Finance teams need useful outputs quickly, but the underlying design must be robust enough to support future growth.

Why Brydens BI Is a Strong Fit for Sage Intacct Finance Teams

Brydens BI combines finance domain expertise with practical data and Calumo implementation experience.

That combination matters. A successful Sage Intacct and Calumo project requires more than technical integration. It requires a clear understanding of finance processes, month-end pressure, board reporting expectations, budgeting cycles, consolidation logic, reconciliation requirements and the way finance teams use Excel.

Our work is hands-on and relationship-led. We help clients design the model, build the solution, validate the outputs, train finance users and continue improving the environment after go-live.

For Sage Intacct clients, Brydens BI brings:

  • Hands-on Sage Intacct and Calumo integration experience
  • Deep finance reporting and FP&A capability
  • Practical consolidation and management reporting experience
  • Azure Finance Data Warehouse design
  • Experience integrating finance, HR, CRM and operational data
  • A finance-led delivery approach
  • Ongoing support beyond the initial implementation

The result is a Calumo solution that is not just technically connected to Sage Intacct, but genuinely useful to the finance team.

Learn more about our approach to Calumo implementation and support.

Related Calumo and ERP Reporting Solutions

Brydens BI also supports reporting, budgeting, forecasting, dashboards, process automation and FP&A solutions across other finance systems, operational platforms and data sources.

Common Sage Intacct and Calumo Questions

Can Calumo connect to Sage Intacct?

Yes. Brydens BI has delivered Calumo solutions connected to Sage Intacct for multiple clients, including Acumentis, Energy One and ALAND.

Why use Calumo if we already have Sage Intacct?

Sage Intacct is the core financial management system. Calumo provides an extended reporting, consolidation, budgeting, forecasting and FP&A layer around it. This is especially useful when finance needs more flexible reporting, scenario modelling, Excel interaction, workflow, or integration with non-financial systems.

Can Calumo combine Sage Intacct with HR, CRM or operational data?

Yes. This is one of the key benefits. Brydens BI has delivered solutions where Sage Intacct data is combined with systems such as Employment Hero, HiBob, HubSpot and internal operational platforms.

Can Calumo support rolling forecasts from Sage Intacct actuals?

Yes. Sage Intacct actuals can be loaded into the Calumo finance data model and used as the foundation for rolling forecasts, budgeting and scenario planning.

Can Calumo support consolidation across Sage Intacct entities?

Yes. Calumo can support multi-entity consolidation, intercompany reporting, mapping logic, eliminations and reconciliation processes around Sage Intacct data.

Can we keep using Excel?

Yes. Calumo supports finance-friendly Excel interaction while improving governance, consistency and control over the underlying data model.

Is Calumo useful if Sage Intacct is only one of our finance systems?

Yes. This is often where Calumo is most valuable. Brydens BI can combine Sage Intacct with other systems such as HR, CRM, project, contract, operational or industry-specific platforms.

Is this only for large organisations?

No. The value is strongest where reporting, consolidation, forecasting or analysis has become too complex for standard ERP reporting and unmanaged spreadsheets. That can happen in listed companies, private groups, multi-entity businesses, project-based organisations and fast-growing companies.

A Practical Next Step for Sage Intacct Finance Teams

For Sage Intacct finance teams looking to improve consolidation, reporting, budgeting, forecasting or broader FP&A capability, Brydens BI can help design and support a practical Calumo solution around your Sage Intacct environment.

Because Brydens BI has delivered Calumo solutions for Sage Intacct clients such as Acumentis, Energy One and ALAND, future clients can benefit from a more informed starting point, proven hands-on experience and an ongoing relationship focused on continuous improvement.

Talk to Brydens BI about Sage Intacct reporting, budgeting, forecasting and FP&A with Calumo.

Calumo for NetSuite: Reporting, Budgeting, Forecasting and FP&A Solutions

NetSuite gives finance teams a strong financial system of record. Brydens BI helps extend that foundation with Calumo, creating a more flexible environment for management reporting, consolidation, budgeting, forecasting and broader FP&A.

Rather than treating Calumo as a simple reporting and planning add-on, we focus on how finance actually works day to day. We work with CFOs, finance leaders and internal reporting teams to understand their reporting structures, planning cycles, approval processes and decision-making needs, then design Calumo solutions that support those requirements in a practical and sustainable way. A core strength of Calumo is its flexibility and maturity, and Brydens BI uses that flexibility to design solutions around the way each finance team actually works.

Brydens BI has delivered Calumo solutions for organisations using NetSuite, including Betashares and Zip Money. These projects demonstrate how finance teams can move beyond standard ERP reporting and create a governed performance management layer that brings together financial results, budgets, forecasts, management views, operational inputs and executive reporting in one controlled environment.

Why NetSuite Finance Teams Look Beyond ERP Reporting

NetSuite provides strong cloud ERP capability, but finance teams often need more than standard ERP reporting.

As businesses grow, reporting and planning requirements usually become more complex. Finance teams need consolidated management reports, board packs, budget-to-actual reporting, rolling forecasts, scenario modelling, KPI dashboards and flexible analysis by entity, division, product, region or cost centre.

They also need confidence that the numbers reconcile, the mappings are controlled, and the reporting logic is repeatable from month to month.

That is difficult to sustain when key reporting and planning processes depend on disconnected spreadsheets, manual exports and one-off adjustments.

Calumo gives NetSuite finance teams a structured performance management layer that extends the value of their ERP. Finance users can continue working in familiar Excel-based reporting and planning environments where appropriate, while gaining stronger governance, consistency and control over the underlying data. By bringing detailed GL transaction data into Calumo, users can also drill back into NetSuite to review the related journals and supporting detail when needed.

In implementation, this can extend beyond standard balances to include vendor detail (and enriching this), statistical data, custom NetSuite attributes and transaction-level reporting, so the Calumo model reflects the way the client actually manages and analyses the business.

Practical Calumo and NetSuite Experience

Brydens BI has hands-on experience delivering Calumo solutions for organisations using NetSuite. Our role typically extends beyond initial implementation into ongoing support, refinement and enhancement as the finance team’s requirements evolve.

Betashares: Calumo, NetSuite and BigQuery

For Betashares, Brydens BI linked Calumo to NetSuite financials and the organisation’s internal Google BigQuery data warehouse.

The solution supported automatic consolidation, planning, advanced reporting and dashboards. It also gave the internal team a platform they could continue to build on, with reporting and dashboard capability able to evolve alongside the business.

This type of solution is valuable where NetSuite is one important source of financial data, but not the only source of information needed for management reporting and decision support.

Zip Money: Calumo Through Growth and NetSuite Migration

For Zip Money, Calumo was adopted early to automate consolidation across multiple Xero and other general ledger environments.

As the business grew and later migrated to NetSuite, Calumo helped preserve continuity in consolidated reporting, forecasting and decision-support through a direct NetSuite integration.

That continuity matters. Finance systems change, business structures change and reporting expectations change. A well-designed Calumo layer can reduce disruption by keeping core reporting logic, planning processes and management outputs consistent while the ERP landscape changes.

What a Calumo and NetSuite Solution Can Deliver

A successful Calumo and NetSuite solution is not just a technical integration. The value comes from designing the finance model properly.

Brydens BI works with finance teams to understand the reporting structures, planning cycles, consolidation requirements, business rules and management outputs that matter. From there, we build a solution that can support day-to-day finance operations and continue to improve over time.

Depending on the client, this may include:

  • NetSuite integration into Calumo and a governed Finance Data Warehouse
  • Multi-entity consolidation, eliminations and management reporting structures
  • Board, executive and monthly finance reporting packs
  • Budgeting, forecasting and scenario modelling
  • Dashboards, KPI reporting and drill-through analysis
  • Integration with other finance, operational, HR, CRM or data warehouse sources
  • Excel-enabled reporting and planning with stronger governance
  • Ongoing support, enhancement and finance-team enablement
  • User security by entity, cost centre or budget responsibility, controlling both what users can see and where they can enter budget or forecast data

The aim is not to replace NetSuite. NetSuite remains the ERP and financial system of record. Calumo provides the finance-owned layer for reporting, planning, forecasting and FP&A.

From NetSuite Reporting to Broader FP&A

Many NetSuite clients begin with a reporting problem.

Month-end reporting takes too long. Consolidation requires too much manual effort. Forecasting is disconnected from actuals. Board reporting depends on spreadsheets that are hard to maintain. Different teams may have different versions of the numbers.

Once NetSuite data is connected into a governed Calumo model, finance teams can start to address those issues in a more structured way.

Actuals, budgets, forecasts, mappings, hierarchies and reporting logic can be brought together into one environment. That creates a stronger foundation for monthly management reporting, board reporting, multi-entity consolidation, annual budgeting, rolling forecasts, scenario analysis, workforce planning, cost planning, cash flow forecasting and operational KPI analysis.

The real benefit is not simply faster reports. It is a better finance operating model. Finance teams spend less time assembling numbers and more time explaining performance, testing assumptions and supporting better business decisions.

Why the Data Model Matters

One of the most important parts of any NetSuite and Calumo project is the data model.

A connector can move data from one place to another, but it does not automatically create a useful finance model. Finance teams need the data structured around how the business is managed.

That can include management account mappings, alternate reporting hierarchies, entity structures, cost centre views, product views, eliminations, forecast versions, budget cycles and reporting packs that differ from the statutory chart of accounts.

Clients can use the NetSuite account rollup where appropriate, while also maintaining additional management or statutory hierarchies directly in Calumo so reporting structures remain practical for finance users to manage.

Brydens BI focuses on this design work because it is where many reporting and planning projects succeed or fail. A good Calumo model should be technically reliable, but also practical for finance users to maintain, review and explain.

Supporting NetSuite Clients Over Time

Finance reporting and planning requirements are rarely static.

A business may add new entities, change reporting lines, acquire another company, introduce new products, restructure cost centres, change its board reporting pack or adopt new forecast processes.

For that reason, Brydens BI places significant emphasis on ongoing relationships. We often continue working with finance teams after the initial implementation to support month-end reporting, improve existing models, add new reporting views, refine forecasting logic, extend dashboards and help internal users become more self-sufficient.

This ongoing relationship is important because Calumo is most valuable when it evolves with the finance function. The first release may solve the immediate reporting or consolidation problem, but the platform can then be extended into broader planning, analytics and FP&A capability.

Calumo for NetSuite During System Change

Calumo can be especially useful during periods of finance systems change.

When an organisation migrates to NetSuite, the ERP implementation is usually only one part of the finance transformation. Management reporting, consolidation, board packs, budgets and forecasts still need to keep operating during and after the transition.

A Calumo layer can help preserve continuity by separating core reporting and planning logic from the source ERP. As long as the data is mapped and governed properly, finance teams can maintain familiar reporting outputs while the underlying system landscape changes.

This was an important part of the Zip Money story. Calumo supported consolidated reporting and planning before NetSuite, and then continued to support the finance team after the move to NetSuite through direct integration.

For growing businesses, this flexibility can be valuable. It allows finance teams to modernise systems without losing control of the reporting and planning processes that senior management relies on.

Greenfield Calumo and NetSuite Projects

For organisations starting fresh with NetSuite and Calumo, Brydens BI would typically begin with the highest-value finance outcomes.

That often means connecting NetSuite financial data into Calumo, validating actuals, building core reporting hierarchies, designing consolidation logic, creating management reports and establishing the first budgeting or forecasting model.

From there, the solution can be expanded into dashboards, operational reporting, workforce planning, cash flow forecasting, scenario modelling and broader FP&A.

A practical implementation should balance speed and governance. Finance teams need useful outputs quickly, but the underlying design must be robust enough to support future growth.

Why Brydens BI Is a Strong Fit for NetSuite Finance Teams

Brydens BI combines Calumo implementation experience with finance, consolidation, reporting, forecasting and data warehousing capability.

That combination matters. A successful NetSuite and Calumo project requires more than technical integration. It requires a clear understanding of how finance teams work, how reporting packs are produced, how forecasts are reviewed, how boards consume information and how data needs to be controlled.

Our work is hands-on and relationship-led. We help clients design the model, build the solution, validate the outputs, train finance users and continue improving the environment after go-live.

For NetSuite clients, Brydens BI brings:

  • Proven Calumo and NetSuite integration experience
  • Practical finance reporting and planning design
  • Multi-entity consolidation expertise
  • Budgeting, forecasting and FP&A capability
  • Finance Data Warehouse architecture
  • Experience supporting growing and changing finance teams
  • Ongoing support beyond the initial implementation

The result is a Calumo solution that is not just technically connected to NetSuite, but genuinely useful to the finance team.

Related Calumo and ERP Reporting Solutions

Brydens BI also supports reporting, budgeting, forecasting, dashboards, process automation and FP&A solutions across other finance systems, operational platforms and data sources.

Common Calumo and NetSuite Questions

Does Calumo integrate with NetSuite?

Yes. Calumo can be integrated with NetSuite financial data to support reporting, consolidation, budgeting, forecasting and FP&A processes.

What is the benefit of using Calumo with NetSuite?

Calumo helps NetSuite finance teams create more flexible management reports, budget models, forecasts, dashboards and consolidation processes than are often practical using ERP reporting alone.

Is Calumo a replacement for NetSuite?

No. NetSuite remains the ERP and financial system of record. Calumo acts as a reporting, planning and FP&A layer around NetSuite.

Can Calumo improve NetSuite reporting?

Yes. Calumo can extend NetSuite with a finance-ready reporting layer for management reporting, board reporting, dashboards, consolidation, budgeting and forecasting. It can also support transaction-level drill-through, enriched NetSuite data such as vendor detail, statistical measures and custom NetSuite attributes, as well as security by entity, cost centre or budget responsibility. Where required, Calumo can also bring in operational, HR, CRM, data warehouse or other non-NetSuite sources to support broader reporting and FP&A.

Can Calumo support NetSuite consolidation?

Yes. Calumo can support multi-entity consolidation, including rules-based eliminations, mapping logic, reporting hierarchies and controlled month-end processes.

Can we keep using Excel with NetSuite and Calumo?

Yes. One of Calumo’s strengths is that it allows finance teams to continue using Excel where it makes sense, while improving governance, consistency and control over the underlying data.

Can Calumo combine NetSuite data with other systems?

Yes. Calumo can combine NetSuite data with other sources such as data warehouses, HR systems, CRM platforms, operational systems and manual planning inputs.

Can Calumo help during a migration to NetSuite?

Yes. Calumo can help preserve reporting and planning continuity during system change by maintaining finance logic, reporting structures and planning processes in a governed layer around the ERP.

A Practical Next Step for NetSuite Finance Teams

For NetSuite finance teams looking to improve consolidation, reporting, budgeting, forecasting or broader FP&A capability, Brydens BI can help design and support a practical Calumo solution around your NetSuite environment.

Because Brydens BI has delivered Calumo solutions for NetSuite clients such as Betashares and Zip Money, future NetSuite clients can benefit from a more informed starting point, proven hands-on experience and an ongoing relationship focused on continuous improvement.

Talk to Brydens BI about Calumo for NetSuite reporting, budgeting, forecasting and FP&A solutions.

HubSpot Reporting and Dashboards: Two Real-World Case Studies

For many businesses, HubSpot holds some of the most important commercial data in the organisation. It tracks opportunities, pipeline stages, expected close dates, deal values, and sales activity. But when reporting still depends on exports, spreadsheets, and manual updates, that value is constrained.

At Brydens BI, we help businesses connect systems like HubSpot into structured reporting environments so leadership teams can access clearer, more timely commercial insight. This includes live dashboards, automated reporting, and analysis that goes well beyond standard CRM views.  We typically use Calumo, where we have already linked through to the core ERP(s)/General Ledger(s), HR and similar systems.

Below are two examples of how connected reporting can transform the way businesses use HubSpot data for management reporting, dashboards, and decision-making. You can also see more examples of Brydens BI client work on our Clients page.

Case Study 1: Live pipeline reporting for a major construction business

A large privately held Australian construction company wanted better visibility over its pipeline of potential work. Before the new setup, the team exported data from HubSpot into Excel and maintained a series of smart charts together with a full pipeline listing in a Gantt-style worksheet. The process was survivable and took a few hours, but it had an obvious weakness. In the lead-up to the weekly meeting, staff were still updating HubSpot. By the time the reports were finalised and the meeting began, the information was already out of date.

Brydens BI replaced that lagging process with a live reporting approach. At the start of the meeting, an update is triggered. It takes a couple of minutes, and then the reporting is online, current, and ready for review. Instead of working from static extracts, the team can review live pipeline reporting that is drillable to detailed deal-level information and linked to budgets and actuals outside HubSpot.

The new reporting environment also provides a full pipeline listing report in Gantt format, making it much easier to review potential work in a structured and practical way. Users can filter the reporting by Contract Type, Bid Type, Sector, Pipeline Stage, Location, Go or No Go status, and of course individual deals. That gives management a much more flexible way to assess the pipeline and focus on the opportunities most relevant to planning and commercial review.

For a construction business, that is a meaningful shift. Pipeline reporting does not just support business development. It informs discussions around timing, capacity, budgeting, future workload, and the broader commercial outlook. The value was not simply faster reporting. It was having reporting that stayed aligned with the live state of the business at the point decisions were being made.

Case Study 2: Automated deal reporting for a listed software company

A listed Australian software company with operations across Europe and Australasia needed a more consistent and consolidated approach to deal reporting. Different countries had developed their own reporting methods in Excel, including some strong spreadsheet and Power Query work. But the process took time, the outputs were not fully consistent, and the reporting sat apart from the company’s broader management reporting environment.

That created a practical problem for leadership. There was no single consolidated view of pipeline and deal activity across the business, and it was difficult to bring CRM reporting together with actuals, budgets, and other key financial information in a consistent way.

Brydens BI connected HubSpot into a central reporting environment so that deal and pipeline reporting could be produced in one place, using one approach, with current information always available. Instead of maintaining separate country-based reporting processes, the business could access up-to-date reporting in a unified environment that aligned with the rest of its finance and management reporting.

The reporting now brings through a rich set of commercial dimensions, including currency, deal source, deal type, product line, pipeline stage, deal owner, detailed deal line items, likelihood, company, and of course deal. This makes it far easier to analyse the pipeline in a way that reflects how the business actually operates.

It is also easy for the team to refresh dashboards for different geographic regions, different deal types, and review values by currency. That means leadership can move from manually assembling regional updates to working with a current, consolidated, and far more useful reporting view.

This made the reporting more valuable at an executive level. Pipeline and deal analysis no longer sat in isolated Excel files. It could be viewed alongside actual and budget reporting and incorporated more easily into key management reports and dashboards. The improvement was not just speed. It was consistency, consolidation, and much better visibility across regions.

For a multi-region software business, that kind of reporting capability is important. It gives leadership a more reliable basis for understanding sales activity, comparing regional performance, and linking commercial pipeline information back to the wider reporting framework of the business.

What better HubSpot reporting looks like

These two examples show a common pattern. Businesses often already have the right data in HubSpot, but they do not yet have the reporting structure needed to turn that data into useful management insight.

When HubSpot is connected properly, businesses can:

  • Improve pipeline visibility
  • Automate deal reporting
  • Reduce manual reporting effort
  • Create clearer dashboards for leadership
  • Analyse opportunities across teams, regions, products, or business units
  • Link CRM information with budgets, actuals, and broader management reporting
  • Support planning and decision-making with more timely information

This is where Brydens BI adds value. We help businesses move from fragmented CRM reporting to connected, decision-ready reporting.

How Brydens BI helps

Brydens BI works with finance and leadership teams to improve reporting, dashboards, planning, and analysis across the systems that drive business performance. That includes CRM platforms like HubSpot, where commercial data can play a critical role in forecasting, pipeline visibility, and management reporting.

Whether the requirement is live pipeline dashboards, automated deal analysis, or more reliable executive reporting, the goal is the same. Create a clearer view of performance and reduce the manual effort involved in producing it. For more insight into this approach, visit the Brydens BI Insights page.

Final thoughts

If your business uses HubSpot as a core commercial system, but reporting still depends on spreadsheets and manual updates, there is a better way to work.

Connecting HubSpot into a structured reporting environment can improve visibility, strengthen analysis, and give leadership a clearer picture of pipeline and deal activity.

At Brydens BI, we help businesses turn HubSpot data into practical reporting and dashboards that support better decisions.

Looking to improve HubSpot reporting?
Brydens BI helps businesses connect HubSpot into live dashboards, automated reporting, and broader management reporting environments.

Why Better Forecasting Starts Above the Detail

Finance teams are often asked to answer big business questions quickly.

What happens if we expand into a new region?
What happens if we run a major promotion?
What happens if a product launch slips by a quarter?
What happens if we invest more heavily in sales capacity?

These are all valid forecasting questions. But they are not always detailed modelling questions, at least not at the beginning.

A common mistake is to dive straight into the weeds. The discussion quickly turns to unit volumes, product mix, exact pricing, and which cost lines need to move. Before long, a lot of effort is going into rebuilding the model, but the business is still no clearer on whether the idea makes sense.

That is one of the biggest forecasting challenges we see.

The purpose of forecasting is not to produce the most detailed answer as early as possible. The purpose is to help the business think clearly about change, uncertainty and likely impact. In many cases, that means starting at a higher level.

As we covered in our article on context-driven forecasting, the most useful forecast is often the one that helps the business respond to what is being discussed now, rather than the one that perfectly updates the existing planning structure.

The trap of too much detail

Detailed models have an important role.

When the business is ready to commit to a plan, allocate resources, set targets or track operational performance, detail matters. At that point, it improves accountability and helps connect financial outcomes to operational drivers.

But there is a problem when finance reaches for that level of detail too early.

When an idea is still being explored, too much detail can slow the thinking down. It creates long discussions around assumptions that are not yet the real issue. It can give a false sense of precision. And it often delays the point at which management gets a useful answer.

Instead of asking, “What is the likely impact if we enter this market?”, the conversation becomes, “What exact monthly volume should we assume for each category in month seven?”

That level of detail may become necessary later. But in the early stages, it can distract from the bigger question.

This is particularly common in Excel-based environments, where forecasting models often become highly detailed over time. They may be powerful, but they can also be slow to adapt when the business wants to test a new idea. We touched on this more broadly in When Complex Finance Processes Need More Than Excel.

The question leaders are really asking

When executives discuss a possible change, they are usually trying to understand the shape of the impact before they worry about every line item.

They want to know:

  • Is this likely to be material?
  • When would the impact begin?
  • Would it affect revenue, margin, cash flow or capacity most?
  • What are the key risks?
  • What range of outcomes should we expect?

These are high-level questions, but they are still forecasting questions.

In many cases, they are the most important forecasting questions because they influence whether the business goes ahead at all.

That is why forecasting should not always begin with detailed bottom-up mechanics. Sometimes it should begin with a structured way of thinking about the business event itself.

For example:

  • expanding into a new geography
  • running a major promotion
  • losing a major customer
  • delaying a product release
  • increasing sales headcount
  • changing pricing strategy

Each of these can be modelled initially at a higher level. The business does not always need a fully rebuilt operational forecast on day one. It often needs a sensible first-pass view of impact, timing and risk.

High-level forecasting is not less rigorous

There can be an assumption that high-level forecasting is somehow less disciplined than detailed forecasting.

In practice, that is often not true.

A good high-level forecast forces the business to be clear about what is actually changing and why. It focuses attention on the main drivers of impact. It helps separate signal from noise. And it allows finance to test multiple scenarios quickly, rather than spending days building detail around a single version of the future.

This is especially valuable when the business is still discussing strategic options.

At that point, the goal is not to prove one exact outcome. The goal is to help decision-makers understand what is likely, what is possible, and which assumptions matter most.

That creates better conversations. It also makes finance more useful to the business, because finance is contributing while decisions are still being shaped.

This aligns closely with the thinking behind context-driven forecasting, where business context helps shape the forecast rather than simply relying on historic patterns and static model structures.

A practical example

Take a business considering expansion into a new region.

A traditional response might be to begin with product-level volume assumptions, local pricing structures, staffing plans, logistics costs, marketing phasing and a range of support schedules. All of that may eventually be useful.

But it may not be the right place to start.

A better first step is often to model the idea at a higher level:

  • What is the likely timing of market entry?
  • What scale of revenue opportunity is realistic in year one?
  • How might gross margin differ from the existing business?
  • What setup and support costs are likely to arise?
  • What are the main upside and downside scenarios?
  • What is the likely effect on cash flow and operating capacity?

That gives management an early view of the shape of the decision.

If the business decides to proceed, the forecast can then be refined with more operational detail. But the first stage has already done something valuable. It has helped the business think clearly before getting pulled into the mechanics.

The same logic applies to major promotions, pricing changes, new channels, capacity expansion, or shifts in demand. Before the business needs a perfect model, it usually needs a useful one.

Where ForesightXL fits

This is where ForesightXL becomes particularly relevant.

One of its strengths is that it allows finance teams to work in Excel while taking a more flexible approach to forecasting. Rather than requiring every change to be translated immediately into a fully reworked model, it helps teams consider business context in a structured and explainable way.

This is particularly useful when a CEO or leadership team is weighing up several possible courses of action at once. They may be discussing expansion into a new region, a major promotion, a pricing change, or a different pace of investment. Those ideas are usually expressed in plain business language, not in the language of model drivers and worksheet logic.

That is where ForesightXL has practical value. It accepts plain English inputs, which means those options can be tested and refined in Excel while the discussion is still taking shape. Finance can work through alternative scenarios, challenge assumptions, and narrow the field before committing time to a more detailed rebuild of the forecast.

That matters because many organisations do not need another disconnected forecasting system. They need a better way to think within the environment they already use.

ForesightXL supports that by allowing teams to model business events and scenarios at the level that makes sense for the decision at hand. It is not about removing financial discipline. It is about making forecasting more responsive, more commercial and more useful.

Instead of getting trapped in the detail too early, finance can assess the likely impact of a decision, explore a range of outcomes, and then go deeper where the detail genuinely adds value. The broader ForesightXL forecasting framework reflects that same principle by focusing attention on the factors that matter most.

Start high, then go deeper when it matters

Detailed forecasting still matters.

Budgets matter. Rolling forecasts matter. Driver-based planning matters.

But finance teams should be careful not to assume that every new business question needs to begin with a full rebuild of the model.

Often, the better approach is to start one level higher. Understand the event, assess the broad impact, test a few scenarios, and identify the assumptions that matter most.

Then, if the decision progresses, bring in the detail where it adds value.

Forecasting should help the business decide, not just document assumptions.

And in many cases, better forecasting starts above the detail.

Closing

If your forecasting process gets pulled too quickly into complexity, it may be worth stepping back and asking a simpler question first. What is the business really trying to understand?

ForesightXL helps finance teams model business context in Excel, making it easier to test strategic ideas, explore scenarios and support better decisions. We also covered a related perspective in How Finance Teams Should Evaluate AI Forecasting Tools.

What a Finance Data Warehouse Should Actually Contain: A CFO’s Practical Architecture Guide

At Brydens BI, one of the most common things we see in finance teams is not a lack of data. It is the opposite.

There is data in the ERP. Data in payroll and HR systems. Data in CRM platforms. Data in project systems. Data in operational systems. Then there are all the spreadsheets built over time to bridge the gaps between them. Before long, reporting slows down, definitions drift, and more of the finance team’s time is spent stitching numbers together than actually analysing them.

That is where a Finance Data Warehouse becomes important.

In our experience, a Finance Data Warehouse works best when it gives Finance a single trusted, governed environment that brings together financial, workforce, and operational data into a structure designed for reporting, consolidation, planning, forecasting, and automation.

The key point is this: a Finance Data Warehouse is not just somewhere to store data. It is a curated finance model. It should make close, reporting, planning, and forecasting faster, more reliable, and easier to explain. And if it is designed properly, it also becomes the foundation for automation and the careful introduction of AI.

What a Finance Data Warehouse is, and what it is not

At a practical level, a Finance Data Warehouse is a structured, governed data layer designed specifically for Finance.

It should support:

  • periodic and on-demand reporting
  • management and board reporting
  • budgeting and rolling forecasts
  • multi-entity consolidation
  • allocations and adjustments
  • drill-through and auditability
  • scenario modelling

What it should not be is a generic dumping ground for data.

We often see confusion here. A data lake and a Finance Data Warehouse are not the same thing. A data lake may be useful for storing large volumes of broad enterprise data, but that does not automatically give Finance a trusted reporting and planning environment. In our view, the Finance Data Warehouse is the curated, finance-ready layer that sits closer to the actual decision-making needs of CFOs, finance leaders, and boards.

It is also not just a dashboarding layer. A dashboard can present numbers nicely, but if the underlying mappings, hierarchies, and business rules are inconsistent, all you have done is make inconsistent reporting look more polished.

A proper Finance Data Warehouse is where the meaning of the numbers is defined, controlled, and maintained.

The 7 core components every Finance Data Warehouse should contain

1. Core financial actuals

At the centre of the model should be the core financial data: actual GL transactions, chart of accounts, entities, cost centres, departments, currencies, and accounting periods.

This sounds obvious, but in practice it is often not handled well. We regularly see environments where only summary-level data is available, or where the structure is too limited to support the real questions finance needs to answer.

In our experience, Finance needs enough granularity and enough structure to support both recurring management views and deeper drill-through when needed.

For example, in our work with Tasmea, Calumo is used to ingest transaction-level GL data across subsidiaries and map it to a unified chart of accounts, allowing simple consolidation that previously lived in large excel workbooks. It also allows trusted dashboards and management reporting. This foundation has also been used to capture, calculate and report ESG data using a simple (sophisticated under the hood) and consistent approach.

2. Consolidation-ready structures

If the business operates across multiple entities, the warehouse needs to do more than hold balances. It should support the structures required for group reporting:

  • entity hierarchies
  • ownership structures
  • intercompany logic
  • elimination rules
  • management only adjustments
  • multi-currency handling
  • constant-currency handling
  • management and statutory views where required

Without this, finance teams usually end up rebuilding consolidation logic outside the governed model, which defeats much of the purpose.

A common pattern we see is that businesses think they have centralised their data, but the hardest parts of consolidation are still being managed offline in spreadsheets or separate workbooks.

In our experience with Salta Properties, this was addressed by integrating NAV, multiple Xero entities, and MRI imports into a Calumo environment that supported automated eliminations and reporting across the group and for both Development and Investment Property portfolios. That is a good example of what consolidation-ready structure looks like in practice.

3. Budget, forecast, and scenario data

A Finance Data Warehouse should not stop at actuals.

If it is going to support planning and performance management properly, it also needs controlled structures for:

  • budgets
  • rolling forecasts
  • scenario versions
  • assumptions
  • planning drivers
  • plan versus actual comparisons

We often see finance teams managing budgets and forecasts in separate models with different logic, different definitions, and different assumptions. That makes reporting slower, weakens forecast confidence, and creates unnecessary reconciliation work.

In our experience, the strongest environments are the ones where actuals, budgets, forecasts, and scenarios all sit within the same governed finance structure.

A good example is Aware Super, where Sun GL and HR data are linked into Calumo for detailed reporting, budgeting, and forecasting, alongside a sophisticated cost allocation engine that replaced large, slow Excel workbooks. The same allocation engine is used for both Actuals and Plan scenarios, and the rolling forecast automatically picks up staff changes.

4. Workforce and operational drivers

A finance-only warehouse that ignores the operational drivers of performance is often too narrow.

Most finance teams need more than financial actuals. Depending on the business, they may need:

  • HR and payroll data
  • headcount and FTE metrics
  • sales pipeline information
  • project or job data
  • valuation or asset-level operational data
  • production or service delivery metrics
  • time spent or work completed by staff

At Brydens BI, we often say that the right finance model is broad enough to support better decisions, but not so broad that it becomes unfocused or ungovernable.

The point is not to connect everything. The point is to connect what materially improves finance insight.

For example, in our work with Energy One, reporting is automated across Sage Intacct, HiBob, and HubSpot CRM so management can see finance, HR, and pipeline information across different regions in one environment. The introduction of constant currency options also means actual v plan P&L reporting across different global regions can easily include or exclude the impacts of FX.

Similarly, Acumentis combines Sage Intacct, Employment Hero, and an internal valuation system to support reporting, three-way rolling forecasts, and commission reporting down to employee level. In this case commissions are also calculated in the Finance Datawarehouse as that is where all the critical data lives and where Finance can review and manage it.

These are good illustrations of what happens when workforce and operational drivers are treated as part of the finance reporting model, rather than as disconnected side inputs.

5. A finance-owned business logic layer

This is where many projects succeed or fail.

A Finance Data Warehouse should contain the logic that makes the numbers trustworthy:

  • account mappings
  • hierarchy rules
  • KPI definitions
  • allocation methods
  • treatment of one-off adjustments
  • treatment of intercompany activity
  • forecast and planning rules
  • handling of changes in structure over time
  • security, who can see what, and who can edit what

In our experience, the technology is often the easier part. The harder part is the modelling, metadata, mapping rules, and governance needed to keep the data meaningful as the business evolves.

That is why we believe this layer should be built for Finance and owned by Finance, with strong support from technical specialists. IT and data teams remain critical for platform, engineering, and security, but the meaning of the numbers cannot be left ambiguous or treated as an afterthought.

For example, in our work with Tasmea, the model supports the onboarding of new acquisitions while maintaining consistent mapping logic across subsidiaries. That is exactly the kind of requirement a finance-owned business logic layer should be able to handle.

6. Reporting and drill-through structures

A warehouse is only useful if it is designed for the outputs Finance actually needs.

That means it should support:

  • board packs
  • executive management reporting
  • divisional and project reporting
  • variance analysis
  • drill-through to source logic
  • repeatable monthly reporting structures
  • on-demand, ad-hoc analysis
  • easy integration with Excel

We often see reporting projects that focus heavily on visualisation, but not enough on structure. The result is that the reports may look nice, but the finance team still does a lot of manual work behind the scenes to explain and validate the outputs.

In our view, good reporting architecture should reduce explanation effort, not increase it.

A good example is Cromwell Funds Management, where Yardi data is linked into Calumo for periodic and on-demand updates, supporting consolidation, management reporting, budgeting, and rolling forecasts from a more controlled environment.

7. Governance, controls, and auditability

Finally, the warehouse must be governed.

That includes:

  • controlled refresh processes
  • role-based access
  • version control around planning data
  • auditability of calculations and outputs
  • repeatable close and reporting processes
  • clear ownership between Finance and technical specialists

In our experience, this is where the real long-term value comes from. A Finance Data Warehouse is not just about faster reporting. It is about creating confidence in the reporting process itself.

This also matters if the organisation wants to use automation or AI in finance. Without governance, those tools can amplify inconsistency rather than improve insight.

For example, in our work with Techtronic, Calumo supports structured forecast workflow, allocation logic, foreign currency handling, and both online and Excel-connected forecasting, while moving reporting into a more automated and governed environment. Different country teams have access to only their data, follow their own workflow, and centrally its easy to see where everyone is up to.

From finance data foundation to automation, and then carefully introduced AI

One of the biggest advantages of a Finance Data Warehouse built for Finance and owned by Finance is that it creates a practical path to benefits beyond reporting.

At Brydens BI, we often see organisations reach a point where the issue is no longer just month-end reporting. They also have spreadsheet-based finance processes that have become too important, too complex, or too slow to leave unmanaged.

This is where a governed finance data foundation becomes especially valuable.

Once the data model, mappings, hierarchies, and controls are in place, the same environment can be used to automate finance processes that are often still handled through fragile spreadsheet logic. Instead of rebuilding logic in separate files every cycle, the team can move repeatable processes into a controlled environment with shared data, consistent business rules, auditability, and automation.

We have seen this clearly in cases where finance teams were managing allocations, integrated operational reporting, or other high-value processes in Excel well past the point where Excel was the right long-term tool.

One example we have written about is a large superannuation fund where a spreadsheet-heavy allocation process had been taking 3 to 4 days at month end. By moving that logic into a more controlled environment with rule-driven allocations and automated journal generation, the process was reduced to under 30 minutes and fully allocated numbers became continuously available.

Another example is a diversified property and infrastructure client where we built a finance data warehouse in Microsoft Azure, integrating general ledger data with operational systems and using Calumo for reporting, driver-based modelling, and executive dashboards. That gave leadership a much clearer view of profitability and performance by project, asset, and business unit in one governed environment.

In our experience, this kind of foundation also creates the right conditions for the careful introduction of AI.

AI in finance is most useful when it is applied to well-structured, governed, finance-ready data. Without that foundation, AI can accelerate confusion just as easily as it accelerates insight. We see AI as something to introduce carefully, once Finance has control of the underlying data model and confidence in the business logic behind it.

That is why the sequence matters:

  1. build the finance-owned data foundation
  2. automate repeatable finance processes
  3. introduce AI selectively where it adds real value

In practice, that may mean using the warehouse first to automate allocations, reconciliations, commission logic, or integrated management reporting. Then, once Finance is confident in the structure and meaning of the underlying data, it becomes much easier to introduce more advanced use cases such as AI-assisted forecasting, anomaly detection, pattern identification, or draft commentary creation.

In our view, that is the right way to think about AI in finance. Not as a shortcut around governance, but as a benefit unlocked by good governance.

Which source systems should feed the model?

A common mistake is assuming the answer is “everything.”

In practice, we usually recommend connecting everything that materially improves finance decisions and can be governed properly. This doesn’t need to happen all at once. We typically do this in stages, sometimes over several years, sometime in weeks.

For most organisations, the core sources are:

  • ERP or general ledger systems (normally GL transaction detail)
  • payroll and HR systems
  • planning inputs
  • selected operational platforms (not everything, just what adds value)
  • curated datasets from relevant CRM or pipeline systems
  • curated datasets project, job, estimating or valuation systems

Our experience across clients shows that the right mix depends on what actually drives performance and decision-making. For some businesses that may mean a fairly traditional finance-led structure. For others, it may mean combining ERP, HR, CRM, valuation, or project systems into a more integrated reporting model.

The important point is that a Finance Data Warehouse is not defined by the number of feeds. It is defined by whether the data set is sufficient, reliable, and structured enough to support better finance decisions.

How this differs from a data lake

This distinction matters because the terms are often used interchangeably when they should not be.

A data lake is broad, raw, and flexible. It is useful for storing large volumes of enterprise-wide data, including data that may later support analytics, machine learning, and experimentation.

A Finance Data Warehouse is narrower, more structured, and more controlled. It is designed for precision: consistent reporting, trusted planning, repeatable consolidations, and finance-ready analysis.

In our experience, the two can absolutely coexist. In some environments, they should. But finance leaders should not assume that having a data lake means they already have a finance-ready reporting foundation.

That foundation still needs to be designed.

What good architecture looks like in practice

In practice, a good Finance Data Warehouse usually looks like this:

  1. governed source connections from core finance, HR, and selected operational systems
  2. a finance-centric data model with controlled mappings and hierarchies
  3. a planning and reporting layer that uses the same trusted structures
  4. secure role-based access and auditability
  5. the ability to evolve as the business changes

At Brydens BI, we have found that the best architectures are not the most complicated ones. They are the ones that support how Finance actually works.

The test is simple. Does the environment make reporting, planning, forecasting, and analysis easier, more controlled, and more scalable? If it does, the architecture is doing its job.

Common mistakes that make finance reporting slower, not faster

There are several patterns we see regularly.

The first is loading raw source-system structures into a reporting layer without curating them for finance use. That usually preserves source complexity instead of solving it.

The second is treating the project as a dashboarding exercise rather than a data and logic exercise. Reporting gets prettier, but trust does not improve.

The third is leaving key business rules undocumented or dependent on a small number of people. That creates risk and makes the environment harder to maintain as systems, acquisitions, restructures, and reporting needs change.

The fourth is failing to bring budgets, forecasts, and operational drivers into the same governed structure as actuals.

The fifth is assuming Excel must disappear entirely. In our experience, that is rarely the right way to think about it. The goal is not to ban spreadsheets. The goal is to remove fragility, improve control, and automate the processes that should no longer depend on manual workbook handling.

How to tell if your current environment is missing the basics

A useful self-test is to ask:

  • Can we reconcile actuals quickly and confidently?
  • Can we consolidate entities without heavy offline work?
  • Are our allocation and adjustment rules documented and controlled?
  • Can we compare plan, forecast, and actual from one trusted structure?
  • Can we incorporate HR and key operational drivers without rebuilding models every cycle?
  • Can we drill from reported outputs back to the logic behind them?
  • Could we safely use AI or advanced analytics on this finance data without first cleaning up core definitions?

If the answer to several of these is no, the issue is often not reporting format. It is the absence of a proper finance data foundation.

Final thought

At Brydens BI, we believe a Finance Data Warehouse should be judged by practical outcomes, not architecture diagrams.

If it helps Finance close faster, trust the numbers more, produce board-ready reporting with less effort, run better forecasts, automate repeatable processes, and adapt as the business changes, then it is doing its job.

If it simply stores data but still leaves Finance reconciling spreadsheets, debating definitions, and rebuilding logic every month, then it is not.

The best Finance Data Warehouses are curated, governed, and built around how Finance actually needs to operate. That is why the structure matters so much. It is also why it becomes the foundation not just for better reporting and forecasting, but for finance process automation and the careful introduction of useful, controlled AI over time.

Suggested internal links

If you would like to assess whether your current reporting and planning environment has the right finance data foundations, we would be happy to help review the architecture, identify the gaps, and design a more governed path forward.

When Complex Finance Processes Need More Than Excel

Some finance processes outgrow Excel and need to be moved into proper systems.

They often start in Excel because they need to be defined, but as they grow in complexity and importance, spreadsheets become slower, more fragile, and harder to control.

What begins as a practical model can become difficult to manage as the business grows. Month-end takes too long. Allocations rely on manual handling. Reporting sits across disconnected systems. Critical calculations depend on spreadsheets that are no longer fit for purpose.

That is usually the point where finance teams need more than a better workbook. They need a more scalable system for reporting, planning, and finance process automation, often built around the right data foundation and platforms such as Calumo.

Complex Allocations and Slow Month-End Processes

One of the clearest examples is complex allocations. In some businesses, cost allocations and month-end journals still rely on extensive spreadsheet manipulation. The process can take days, consume senior finance time, and create unnecessary risk. Brydens BI has replaced these spreadsheet-heavy allocation processes with rule-driven allocation logic and automated journal generation, turning a fragile month-end task into a controlled process that runs in minutes rather than days. For a large Superannuation fund client, Brydens BI turned what was a 3-4 day exercise, which dramatically slowed the release of final numbers, into a process that takes under 30 minutes and is always on, enabling users to view fully allocated numbers at any time.

Lack of a Single Source of Truth Across Finance and Operational Data

Another common problem is the lack of a single source of truth across finance and operational data. Financial results may sit in one system, while project data, asset data, payroll information, or other operational drivers sit elsewhere. That makes it difficult for executives to understand what is really driving performance. For a diversified property and infrastructure client, Brydens BI built a finance data warehouse in Microsoft Azure, integrating general ledger data with operational systems and using Calumo for reporting, driver-based modelling, and executive dashboards. The result was a governed environment where leadership could view profitability and performance by project, asset, and business unit instead of trying to piece the picture together from disconnected systems.

Employee Commission Calculations

Commission calculations are another area where spreadsheet strain becomes obvious. These models often require a mix of finance, HR, and operational data, and they become harder to manage as rules grow more detailed and staff numbers grow. One client had employee commissions calculated in Excel using data pulled from the general ledger, HR systems, and internal operational systems. Manageable for 10 staff, problematic at 30, near impossible as staff numbers approached 100. Brydens BI implemented Calumo as the finance and performance layer, linking Sage Intacct, Employment Hero, and the internal operations system into a unified finance data warehouse environment. Commission calculations, even with staff numbers comfortably over 100, are now managed in a controlled, auditable way, with employees given read-only access to their results. The same environment also supports automated reporting and three-way rolling forecasts.

End-to-End Project Knowledge and Predictive Pipeline Visibility

Project-based businesses often face the same problem at a larger scale. Critical data is spread across ERP, CRM, estimating, and other operational systems, making project reporting, estimate benchmarking, and forward planning slower and less reliable than they should be. For one construction client, Brydens BI built a purpose-designed integrated data warehouse that brought together finance, project, CRM, estimating, and operational data into one reporting and modelling environment available to Calumo. This now supports enterprise-wide finance and project reporting, estimate benchmarking, stronger cost modelling for future tenders, reporting across HR, HSEQ, and bank guarantees, and machine learning for forward project pipeline visibility.

Why This Matters

The pattern across these examples is straightforward. As businesses grow, bespoke Excel models often grow with them. They become slower, harder to maintain, and riskier to rely on for critical finance processes. What worked for a smaller or simpler business starts to break down once the organisation needs faster close cycles, more integrated reporting, and better forward visibility.

That is where a more scalable finance platform starts to matter. With the right data foundation and the right reporting and planning layer, finance teams can move away from manual handling and fragmented logic toward a more controlled, transparent, and useful environment. Many of these outcomes can also be seen across Brydens BI’s client examples.

For organisations facing slow month-ends, disconnected reporting, spreadsheet-driven calculations, or limited forward visibility, replacing complex spreadsheets with governed finance systems can materially improve control, speed, and decision-making. The rise of AI-assisted workbook creation may make this issue more pressing, not less. Complex spreadsheet models can now be produced faster than ever, but if the logic is poorly understood, poorly governed, or difficult to maintain, the underlying risk only grows.

Datascape Reporting, Budgeting and FP&A Solutions

Brydens BI has developed a proven Datascape by Datacom integration that helps finance teams extend their ERP environment with stronger reporting, budgeting, forecasting, management reporting and FP&A capability.

Following a recent Australian Local Council project delivered alongside DataScape, Brydens BI now has an established integration pattern that connects Datascape into a cloud-based Finance Data Warehouse designed for finance reporting, analysis and planning.

For organisations already using Datascape, the challenge is often not the ERP itself, but how to extend it for better management reporting, board reporting, budgeting, forecasting, dashboards, and FP&A. That is where Brydens BI helps, delivering Datascape reporting and planning solutions that give finance teams clearer insight and stronger decision support.

Why Datascape Users Need Better Reporting, Planning, Budgeting and FP&A Solutions

Datascape provides strong core ERP capability. For many finance teams, however, the next requirement is not another operational system. It is better visibility, better planning, and better decision support.

Senior finance staff typically need more than transactional processing and standard operational reports. They need management reporting, board reporting, budget-to-actual analysis, commitments visibility, drill-through to transaction detail, forecasting, scenario modelling, and a more controlled way to continue using Excel.

That is where Brydens BI fits. We specialise in finance reporting, planning models, FP&A, management reporting and BI solutions that sit around core financial and operational systems.

A proven Datascape integration built in a live council environment

Brydens BI recently completed a project alongside DataScape for an Australian Local Council that was moving from another system to Datascape. This transition created an opportunity not just to connect the new platform, but to improve the finance reporting environment around it.

In this specific case, the client was migrating from a previous system into Datascape. Because of that, Brydens BI was able to repurpose much of the client’s existing report suite. This accelerated delivery, reduced disruption for finance users, and helped preserve continuity in management reporting during the move to Datascape.

At the same time, Brydens BI worked with DataScape to define the API setup and the integration approach needed to extract key finance data and load it into a cloud-based Finance Data Warehouse optimised for reporting and planning.

What Brydens BI delivered for Datascape

The delivered solution established a working Datascape integration and a finance-ready reporting foundation. Initial scope included both General Ledger transaction detail and Commitments, giving the client immediate value in high-demand finance reporting areas.

  • A proven Datascape integration layer
  • A cloud-based Finance Data Warehouse designed for finance analytics
  • General Ledger transaction detail extraction and modelling
  • Commitments extraction and modelling
  • A rich suite of finance reports
  • On-demand report refresh capability
  • Easy interaction with Excel for finance users
  • A foundation for budgeting, forecasting and broader FP&A

This means Brydens BI is no longer approaching Datascape as a greenfield technical unknown. We now have practical implementation experience that can be applied to future Datascape reporting and planning projects.

From Datascape reporting to budgeting, forecasting and FP&A

Through this project, it became clear that many Datascape clients are likely to need more than core ERP reporting. Finance teams often want to complement Datascape with stronger:

  • Management reporting
  • Budgeting
  • Forecasting
  • FP&A capability
  • Planning models
  • BI and dashboarding
  • Excel-enabled reporting with stronger governance
  • Scenario modelling and decision support

Once the Datascape connection exists, those possibilities open up quickly. The reporting layer becomes a platform for broader finance transformation rather than a collection of standalone reports.

Unlocking Calumo for Datascape clients

With the Datascape integration now established, Brydens BI can help clients unlock the broader value of Calumo. This creates a practical pathway from ERP reporting into a more capable planning and performance management environment.

For Datascape clients, this can support:

  • Budgeting and annual planning
  • Rolling forecasts
  • Scenario analysis
  • Board and executive reporting
  • Dashboarding and management reporting
  • Controlled workflow and accountability
  • Less manual, more scalable Excel-based processes

To learn more about how Brydens BI supports finance teams with Calumo, visit our Calumo page.

The same foundation can also be extended into adjacent reporting requirements, including ESG data gathering, calculation and reporting.

Extending Datascape into ESG Data Gathering, Calculation and Reporting

Brydens BI also brings specialist capability in emissions reporting, helping organisations extend their finance and operational data into a more robust environmental reporting framework. By leveraging the OmniDisclose database for emissions calculations, Brydens BI can support the conversion of underlying activity data into decision-useful emissions outputs across key categories. This gives organisations a practical way to move beyond manual spreadsheets and fragmented methodologies toward a more governed, repeatable and scalable approach to emissions reporting.

The value of this approach is that emissions calculations are not treated as a standalone exercise, but as part of a broader reporting and planning environment. With the OmniDisclose calculation database providing the underlying emissions logic, Brydens BI can help clients connect finance, operational and sustainability data into a single reporting foundation. This supports not only compliance and disclosure requirements, but also management reporting, scenario analysis, target tracking and stronger executive visibility over carbon-related performance.

To learn more, see our related case study: ASX-Listed Industrial Services Group Scaling Group Finance, Forecasting and ESG Reporting with Calumo.

What was covered in the Datascape project

The project included the core technical and reporting components needed to make the solution work in practice. This covered API setup, connector and pipeline development, finance data staging, reconciliation logic, opening balance handling, commitments ETL, hierarchy handling, and report refinement.

The first phase focused on the highest-value finance subject areas:

  • General Ledger transaction detail
  • Commitments reporting

This provided a strong starting point for broader reporting, budgeting, forecasting and planning use cases across the finance function.

Greenfield Datascape reporting projects

In the recent implementation, Brydens BI was able to repurpose much of the client’s existing report suite because the organisation was moving from another finance system into Datascape.

In a true greenfield Datascape reporting and planning project, where reporting assets need to be built from the ground up, we would typically also include:

  • 16 hours of user training
  • 32 hours of initial reporting development

These components help ensure the organisation receives not only the technical integration, but also the user enablement and first-wave reporting outputs required for a successful rollout.

Why Brydens BI is a strong fit for Datascape clients

Brydens BI combines recent Datascape implementation experience with deep capability in finance reporting, planning, FP&A and BI. That matters because the challenge is not simply to move data from one system to another. The challenge is to turn Datascape data into decision-ready finance information.

We are a strong fit for Datascape clients because we bring together:

  • Hands-on Datascape integration experience
  • Finance-focused BI and FP&A capability
  • Planning and forecasting expertise
  • Management reporting design
  • Experience with government, enterprise and finance-led transformation
  • A practical approach to extending ERP platforms with reporting and planning solutions

Learn more about our approach to Implementation and Support .

Common Datascape reporting and planning questions

How can we improve reporting from Datascape?

Brydens BI can extend Datascape with a finance-ready reporting layer for management, executive and operational reporting, built on governed finance data structures.

Can we report on General Ledger detail and commitments more effectively?

Yes. Brydens BI has already delivered a Datascape integration covering General Ledger transaction detail and Commitments, providing a proven starting point for future implementations.

Can we keep using Excel in a more controlled way?

Yes. The reporting environment can support easier Excel interaction while improving governance, consistency and confidence in the underlying finance data.

Can budgeting, forecasting and FP&A be added around Datascape?

Yes. Once the finance data foundation is in place, it becomes far easier to support budgeting, forecasting, scenario modelling and broader FP&A capability around Datascape.

What if we are starting with a blank sheet of paper?

For greenfield projects, Brydens BI would typically include additional time for user training and initial reporting development so the organisation has both a working solution and the internal capability to use it well.

A practical next step for Datascape finance teams

For existing Datascape clients looking for stronger reporting, budgeting, forecasting, planning or FP&A capability, Brydens BI can help design a practical solution around your Datascape environment.

Because the integration pattern has already been established in a live implementation, future Datascape clients can benefit from a more informed, lower-risk starting point and a faster path to value.

Talk to Brydens BI about Datascape reporting and planning

Annual Budgets vs Rolling Forecasts vs Context-Driven Forecasting in FP&A

Finance teams are moving beyond static budgets and periodic forecasts toward real-time, business-aligned, context-driven forecasting.

CFOs are under increasing pressure to respond faster to change, improve forecast confidence, and support better decisions in a more volatile operating environment.

But many forecasting processes still move too slowly. Annual budgets remain essential for governance and accountability, while rolling forecasts provide more regular updates to the outlook. Both matter. But both can lag when business conditions change. If they do not reflect the direction of executive thinking, they can quickly lose relevance.

When customer demand shifts, costs move, delivery constraints emerge, or leadership discussions point to a different outlook, finance often needs to assess the impact immediately rather than wait for the next formal forecast cycle.

That is why many CFOs and finance teams are exploring a third capability: Context-Driven Forecasting.

Context-Driven Forecasting does not replace annual budgets or rolling forecasts. Instead, it adds a new layer of forecasting insight, using AI to combine historical financial time series with broader business context, including executive discussions, forward-looking leadership views, operational signals, and relevant industry developments.

Annual budgets set the direction, rolling forecasts update the outlook, and Context-Driven Forecasting brings forecasting directly into the decision process. It is live, relevant, and grounded in the current business context.

The evolution of financial forecasting. From annual budget to rolling forecast to context driven forecasts.

All of our clients have annual budgets, and most have good, largely automated, rolling forecasts. These remain important, but they are not always close enough to the live decision-making conversations within the business. As a result, finance can seem disconnected, and forecasts may not reflect what is actually shaping executive judgment.

Context-Driven Forecasting: Forecasting Aligned With the Business

Context-Driven Forecasting takes a different approach.

Rather than relying solely on periodic forecast updates, it uses AI to interpret broader business context and generate near-real-time forecast insights.

At its core, Context-Driven Forecasting combines three types of information:

  • Historical financial time series
  • Plain English, qualitative business context
  • External market and industry signals

Historical financial data provides the statistical foundation, including trends, seasonality, and cyclical behaviour. But historical numbers rarely capture the full picture. One-offs or anomalies may be present; context, in natual language, helps identify them, allowing for an adjusted baseline that is far more useful for forecasting.

In most businesses, the really important factors that can shape decisions emerge from:

  • Executive meeting discussions
  • CEO or CFO forward-looking commentary
  • Strategic planning conversations
  • Operational updates from business leaders
  • Emerging industry developments

These factors often reflect what leadership believes may happen next before those expectations are formally embedded into financial models.

Context-Driven Forecasting allows AI systems to analyse these factors, as they are, alongside historical financial trends, producing projections that reflect both numerical evidence and plain Englisgh business context.

The result, when using a standard structure with appropriate guardrails and embedded forecast knowledge, is a near instant forecast with explainable reasoning.

What Annual Budgets, Rolling Forecasts, and Context-Driven Forecasting Each Do Best

These three approaches are most effective when used together.

  • Annual budgets provide governance, accountability, and formal targets.
  • Rolling forecasts refresh the financial outlook on a structured cadence.
  • Context-Driven Forecasting helps finance interpret emerging developments as they arise and bring forecasting more directly into the decision process.

In practice, finance teams often need all three. Budgets support governance. Rolling forecasts support structured planning. Context-Driven Forecasting adds a live, relevant layer, enabling leaders to rapidly assess the impact of changing conditions and clarify their thinking.

Comparing the Three Approaches

Approach Role Frequency Best Use
Annual
Budgets
Governance
and targets
Annual Setting accountability, targets, and resource allocation
Rolling
Forecasts
Updating financial outlook Monthly Refreshing the outlook on a structured cycle
Context
Driven
Forecasting
Incorporating live context Real-time Testing new developments as they emerge

From Forecasting Process to Earlier Decision Support

One of the most important advantages of Context-Driven Forecasting is that it improves the quality and timing of forecasting discussions.

Traditional forecasting often becomes too focused on process. Finance teams gather inputs, update models, and review outputs, but leadership discussions can remain disconnected from the forecast until after the formal update is complete.

Context-Driven Forecasting changes that dynamic.

It allows finance and business leaders to discuss emerging developments while the forecast is still being shaped, not after the fact. Instead of waiting for the next model refresh, leadership can test how changing conditions may affect the forecast while the discussion is still happening. Because this is done using plain Engligh it becomes much faster and much more accessible.

That leads to better decision support. Finance can respond earlier, challenge assumptions more clearly, and help leadership understand the likely financial impact of changes or potential changes in the business.

In many organisations, this shifts forecasting from a periodic reporting exercise to a more active part of strategic and operational decision-making. It makes forecasting a more active part of decision-making and raises its value in leadership discussions, especially when it accurately reflects executive thinking.

How Context-Driven Forecasting Works

In practice, this means finance can have a tool such as ForesightXL open and active during a forecasting or performance review with the CEO.

If a discussion introduces a new product plan, a sales push, or industry development, those points can be added to the forecast context immediately. Leadership can then test, discuss, and assess the potential impact in the moment.

The business context is updated, and the forecast output is refreshed immediately.

Instead of finance taking notes, returning to the model later, and producing a revised forecast hours or days afterwards, leadership can explore the impact while the discussion is still happening.

That makes forecasting more useful as a decision-support process. It also improves clarity. Assumptions are captured when they are discussed, the potential impact is visible straight away, and the reasoning can be reviewed while the context is still fresh.

Applying Live Context Within a Structured Forecast Framework

Context-Driven Forecasting is only valuable when live business context is applied within a defined forecasting framework.

Without structure, leadership views, commentary, and market developments can influence the forecast in inconsistent, hard-to-trace, and hard-to-govern ways. The value of context is not simply that it is added, but that finance can clearly see how it affects specific parts of the forecast.

That is why a framework such as the ForesightXL Five Factor Forecasting Framework matters. Rather than treating the forecast as a single moving number, finance teams can assess how new information affects the adjusted baseline, recurring effects, business drivers, operating constraints, and strategic adjustments. This makes forecast changes easier to explain, challenge, and refine.

Used well, context-driven forecasting does not replace traditional forecasting. It strengthens it by helping finance teams respond earlier to change while maintaining transparency, control, and explainability inside Excel.

Layered financial forecasting diagram showing baseline, recurring effects, business drivers, operating constraints and strategic adjustments.

A Practical Example in Excel

The practical advantage of context-driven forecasting is not simply that it uses AI. It is that AI operates within a structured forecasting process inside Excel, supported by business context, human judgment, and clear guardrails. It fosters conversation and brings forecasting closer to decisions.

In the ForesightXL Five Factor Forecasting Framework worked example, we show how Brydens BI chargeable hours data can be used to separate the adjusted baseline from recurring effects, business drivers, operating constraints, and strategic adjustments. That structure makes it easier to see what comes from historical evidence, what comes from judgment, and which forecast factor each item affects.

The result is a forecast that can be refreshed quickly, reviewed more clearly, and challenged more confidently when leadership wants to test a delayed project, a new sales initiative, or another material change in business conditions.

From Executive Discussion to Forecast Update: An Example

In August, an executive team reviews an Annual Budget prepared eight months earlier alongside the latest Rolling Forecast. The budget assumed revenue growth of 15% by August and 20% for the year, but actual growth to the end of July is just under 6%, with the latest forecast now at 18%.

Since the budget was set, a new product launch was delayed from March to June, reducing its expected December revenue contribution from 10% to 6%, while a new region has outperformed plan, contributing 5% of July revenue versus 3% budgeted.

During the meeting, leadership agrees to accelerate entry into two additional regions from next year into October and approves a temporary doubling of ad spend to build new product momentum. At that point, the existing forecast still contains useful detail, but its core assumptions are already outdated.

Using ForesightXL, those decisions are captured live as structured context. The revenue forecast is refreshed several times during the discussion until a staggered September and November rollout is agreed, with marketing spend tapering into December. The agreed context-driven forecast then becomes the basis for updating the formal rolling forecast over the following days.

The Direction of Modern Forecasting

The finance function is evolving.

CFOs increasingly expect finance teams not only to report on what has happened, but to help the business anticipate what may happen next.

Meeting that expectation requires forecasting processes that are faster, more collaborative, and more closely aligned with the business’s operational reality.

Context-Driven Forecasting supports this shift.

It allows finance teams to combine quantitative analysis with qualitative business insight, identify emerging signals sooner, and participate more actively in strategic discussions.

Annual budgets will remain essential.

Rolling forecasts will continue to provide structured updates.

But as organisations seek to improve forecasting capability, Context-Driven Forecasting offers a valuable additional layer, connecting financial forecasting more directly to the evolving business context.

For modern finance teams, the future of forecasting is not about replacing existing processes. It is about strengthening them with better insight, faster iteration, and deeper collaboration with the business.

Frequently Asked Questions

What is the difference between an annual budget and a rolling forecast?

An annual budget sets formal targets, resource allocations, and accountability for a defined financial year. A rolling forecast updates the expected outlook regularly, often monthly or quarterly, using more recent financial and operational information. In practice, finance teams usually need both: the budget for governance and alignment, and the rolling forecast for a more current view of likely performance.

What is Context-Driven Forecasting?

Context-Driven Forecasting is an approach that combines historical financial time series with broader business context and relevant external signals to generate more responsive forecast insight. It goes beyond periodic model updates by incorporating factors such as executive discussions, operational developments, timing changes, and market movements. The aim is not to replace financial discipline, but to improve the speed at which finance can help the business respond to change.

Does Context-Driven Forecasting replace rolling forecasts?

No. Rolling forecasts remain important for structured planning, governance, and maintaining a formal forward-looking financial view. Context-Driven Forecasting adds another layer by helping finance teams interpret emerging developments between formal forecast cycles and test their likely impact more quickly. Used together, they create a stronger forecasting process that is both disciplined and more closely aligned with real business conditions.

How can AI help with financial forecasting?

AI can help finance teams interpret less-structured inputs, such as leadership commentary, meeting discussions, operational updates, and relevant industry developments, alongside historical financial data. This can improve responsiveness by highlighting emerging signals earlier and helping analysts estimate their potential impact without waiting for the next full forecast rebuild. The real value comes when AI is used within a well-defined forecasting framework that keeps assumptions visible, outputs explainable, and data secure, without requiring system changes or large-scale implementations.

How does ForesightXL fit into this process?

ForesightXL supports a structured forecasting workflow inside Excel by combining historical evidence, business context, and explicit forecast components in a transparent way. It helps finance teams review assumptions, quickly regenerate forecasts, and compare scenarios without rebuilding models from scratch or blending judgment into the baseline. In practical terms, ForesightXL enables Context-Driven Forecasting.

How Finance Teams Should Evaluate AI Forecasting Tools

AI is becoming a bigger part of finance. Teams are being asked to forecast faster, reforecast more often, improve scenario planning, and provide better forward visibility to leadership. At the same time, they still need control, explainability, and confidence in the numbers.

That is why interest in AI forecasting tools is growing. But much of the AI forecasting discussion we see on places like LinkedIn seems to drift away from reality.

Not all AI forecasting tools solve the same problem.

Some help with productivity. Some support broader planning and performance management. Some improve spreadsheet-based workflows. Others aim to bring business context into the forecasting process in a more structured way.

AI Assisted Forecasting in Excel
AI-generated illustration showing black-box AI versus explainable forecasting.

Why AI forecasting matters in finance

Forecasting in finance is no longer a periodic exercise. Many teams are being asked to update forecasts more frequently, respond to changing business conditions faster, and explain forecast movements more clearly.

Used well, AI forecasting tools can help finance teams accelerate forecasting cycles, improve consistency, support scenario thinking, and reduce manual effort. This is accelerated when business context, in plain Engligh, can be used as an input.

But finance forecasting is different from general AI use.

Finance teams are not looking for novelty. They are looking for tools that support planning, judgement, accountability, and decision-making. The market does not need more forecasting hype. It needs simple tools finance teams can and will actually use.

The problem with many AI forecasting discussions

A lot of the discussion around AI in forecasting focuses on speed.

That is understandable. Faster forecasting is valuable.

But speed alone is not enough for finance. A forecast still needs to be credible, explainable, usable in real planning cycles, aligned to business context, and subject to review and challenge.

If a tool generates numbers quickly but cannot show the logic, reflect business reality, or fit existing workflows, it may create more friction than value.

For most teams, the real test is simple: does this make forecasting faster without making it harder to explain?

The main types of AI forecasting tools

A practical way to evaluate the market is to group tools into categories.

1. General AI productivity tools

This category includes tools such as Microsoft 365 Copilot and Claude. These tools are designed to help teams work faster with documents, spreadsheets, notes, and analysis.

For finance teams, they can support tasks such as summarising information, drafting commentary, assisting analysis, and reducing repetitive manual work. They can be a useful first step into AI because they sit close to the way teams already work.

Their limitation is that they are usually not a forecasting method by themselves. They may help around the process, but they do not necessarily provide a structured forecasting approach. It is also worth recognising that this category is evolving rapidly and will continue to change as general-purpose AI tools become more deeply embedded in workplace software.

They can also introduce risk if teams start treating them as a forecasting assistant without properly understanding how and where data is being used, what controls are in place, and how any forecast or output is actually being generated. For finance teams, that matters because speed is useful, but not at the expense of governance, explainability, or confidence in the result.

2. Enterprise planning and performance management platforms

This category includes platforms built for broader planning, forecasting, reporting, and performance management, including solutions such as Calumo, Essbase, TM1, Board, Anaplan, Adaptive, Pigment and JustPerform.

These tools tend to support more governed planning workflows, cross-functional collaboration, scenario modelling at scale, and stronger integration across finance processes.

The trade-off is usually greater implementation effort, more process change, and a longer path to value.

Many of these EPM platforms are now introducing AI capabilities in different forms, and finance teams should look to take advantage of them where they are useful. The key is understanding what investment is required to implement them effectively, how they fit into the broader planning model, and what risks surface around governance, explainability, data handling, and complexity.

Some tools will more naturally fit within and benefit from an organisation’s existing technology environment. Calumo will often feel more natural in Microsoft-oriented environments, where teams may also be better placed to take advantage of broader ecosystem capabilities such as Microsoft Azure AI Foundry, while TM1 sits within the wider IBM Planning Analytics ecosystem. In practice, that can affect integration, deployment choices, internal capability, and how easily teams can make use of new AI features as they emerge.

3. Excel-centric forecasting and FP&A tools

This category is especially relevant for finance teams that want to improve forecasting without moving away from Excel.

That matters because Excel remains central to forecasting in many organisations. It is still where many teams build models, run scenarios, adjust assumptions, and prepare management views.

Examples in this category include Datarails, Vena, Cube, and xpna. These tools aim to improve forecasting and reporting while staying close to spreadsheet-based finance workflows, rather than forcing teams into a completely different way of working.

For many teams, this is a more realistic step than a full platform replacement. The appeal is usually faster adoption, less disruption, and stronger continuity with existing models and finance processes.

That said, these tools still sit in the broader FP&A layer. They may improve planning and forecasting significantly, but they are not the same thing as a dedicated forecasting tool focused solely on the forecasting problem itself.

4. Forecasting tools built around structured business context

This is a narrower category, but an important one. Not every finance team needs another FP&A platform or broader planning layer. In many cases, the real need is more specific: better forecasting.

Most forecasting tools focus heavily on historical data, trends, and statistical patterns. Those are important. But finance forecasts are rarely based on history alone. They are also shaped by management commentary, hiring plans, project timing, customer changes, pricing decisions, one-off events, and leadership judgement.

That is why the most useful forecasting tools are not just the ones that generate a number. They are the ones that help combine historical evidence with natural language business context in a way that remains structured, explainable, and controlled.

This is where ForesightXL fits. ForesightXL is not an FP&A product or a broader planning platform. It is a simple Excel add-in focused specifically on forecasting. Rather than trying to replace existing finance systems or reshape the wider planning stack, it is designed to work alongside current models, finance systems, and planning tools wherever the relevant numbers can be represented in a spreadsheet.

For many finance teams, this can be a practical, low-risk first step into AI-assisted forecasting.

In practice, bringing in context can be very simple. A team might use AI to summarise a management meeting, then paste those plain English meeting notes directly into the forecasting workflow in Excel alongside the numbers. The same can apply to quarterly reports, CEO commentary, or other business updates that help explain what may happen next.

That also gives it a different practical profile. Compared with broader FP&A and planning platforms, a forecasting-specific tool can be much lower cost, require little or no implementation time, and deliver value far more quickly. If it is secure and designed to work within the spreadsheet environments finance teams already trust, it becomes a very different proposition from adopting a larger planning platform or undertaking a more significant planning transformation.

What finance professionals should compare

When evaluating AI forecasting tools, a few criteria matter more than feature lists.

Workflow fit. Does the tool fit the way your team already works?

Explainability. Can the team understand what is driving the forecast?

Use of business context. Can the tool reflect what the business actually knows right now? Can it handle plain English?

Control and governance. Can people review, refine, and apply boundaries to the output?

Time to value. How quickly can the team get practical value?

These are the questions that matter more than feature checklists.

Comparing the Four Main Categories of AI Forecasting Tools

Not all AI forecasting tools solve the same problem. The best choice depends on how your finance team works today, how much structure your data already has, and how important explainability, speed, and workflow fit are to your forecasting process.

General AI productivity tools

Best for: Fast analysis, summaries, ad hoc support

Strengths: Easy to access, flexible, useful for research and first-pass thinking

Limitations: Not purpose-built for forecasting, limited governance, weak auditability, outputs may not be consistent enough for planning processes

Best fit for finance teams that: Want help accelerating analysis, but do not need a forecasting system of record

Enterprise planning / performance platforms

Best for: Large organisations with complex planning requirements

Strengths: Strong controls, structured workflows, enterprise governance, broad planning capabilities

Limitations: Longer implementation cycles, heavier change management, may be more than some teams need for forecasting alone

Best fit for finance teams that: Need standardisation, scale, and cross-functional planning discipline

Excel-centric FP&A tools

Best for: Teams that want to improve planning while staying close to Excel

Strengths: Familiar user experience, easier adoption, can reduce manual effort without replacing existing models

Limitations: AI capabilities may vary, and some tools still depend heavily on structured model design rather than broader business context

Best fit for finance teams that: Want to modernise forecasting without forcing a full shift away from spreadsheet-based workflows

Structured business-context forecasting tools

Best for: Teams that want forecasts shaped by operational and management context, not just historical numbers

Strengths: Can incorporate narrative drivers, business events, and management commentary all in plain English; supports more explainable forecasts in changing conditions; minutes to implement and seconds to forecast.

Limitations: Category is newer, capabilities differ by vendor, and teams still need clarity on where it fits in their broader planning stack

Best fit for finance teams that: Need forecasts that reflect what is actually happening in the business, not just patterns in past data

Evaluate AI Forecasting Based on Fit, Not Hype

The key question is not which AI forecasting category sounds most advanced. It is which one best matches the way your team forecasts, explains results, and supports decisions.

Before choosing any AI forecasting tool, finance teams should step back and define what better forecasting actually means in their business. For some teams, that means more speed. For others, it means better scenario planning, clearer explanations, or forecasts that reflect management’s real view of changing conditions.

A useful evaluation process should focus on practical questions such as:

  • Will this fit into our existing forecasting workflow?
  • Can finance explain the output with confidence?
  • Does it reflect real business context, not just historic data?
  • Will the team adopt it quickly and use it consistently?
  • Does it improve forecast quality without adding unnecessary complexity?

The strongest evaluation process is not based on vendor claims or headline AI features. It is based on practical fit: workflow fit, decision fit, and finance-team fit.

If your team is reviewing AI forecasting options, start by comparing categories first, then assess vendors against the needs of your forecasting process, your governance requirements, and the level of explainability your business expects.

Why Excel Still Matters in AI Forecasting

Excel remains deeply embedded in forecasting because it is flexible, familiar, and practical. Teams use it to model quickly, apply judgement, test scenarios, and work directly with business assumptions.

For many organisations, the best path into AI forecasting will not be replacing Excel. It will be improving forecasting inside Excel with better structure, better context handling, and better explainability.

That is also why the best AI forecasting tool will differ from one organisation to another. Some teams need productivity support. Some need broader planning capability. Some need stronger Excel-based forecasting. And some need a better way to combine historical data with current business context in a disciplined way.

The better way to evaluate AI forecasting tools is not by asking which one sounds most advanced, but by asking which one best fits the way your finance team works, supports better forecasting, and helps explain results with confidence.