
For many businesses, HubSpot holds some of the most important commercial data in the organisation. It tracks opportunities, pipeline stages, expected close dates, deal values, and sales activity. But when reporting still depends on exports, spreadsheets, and manual updates, that value is constrained.
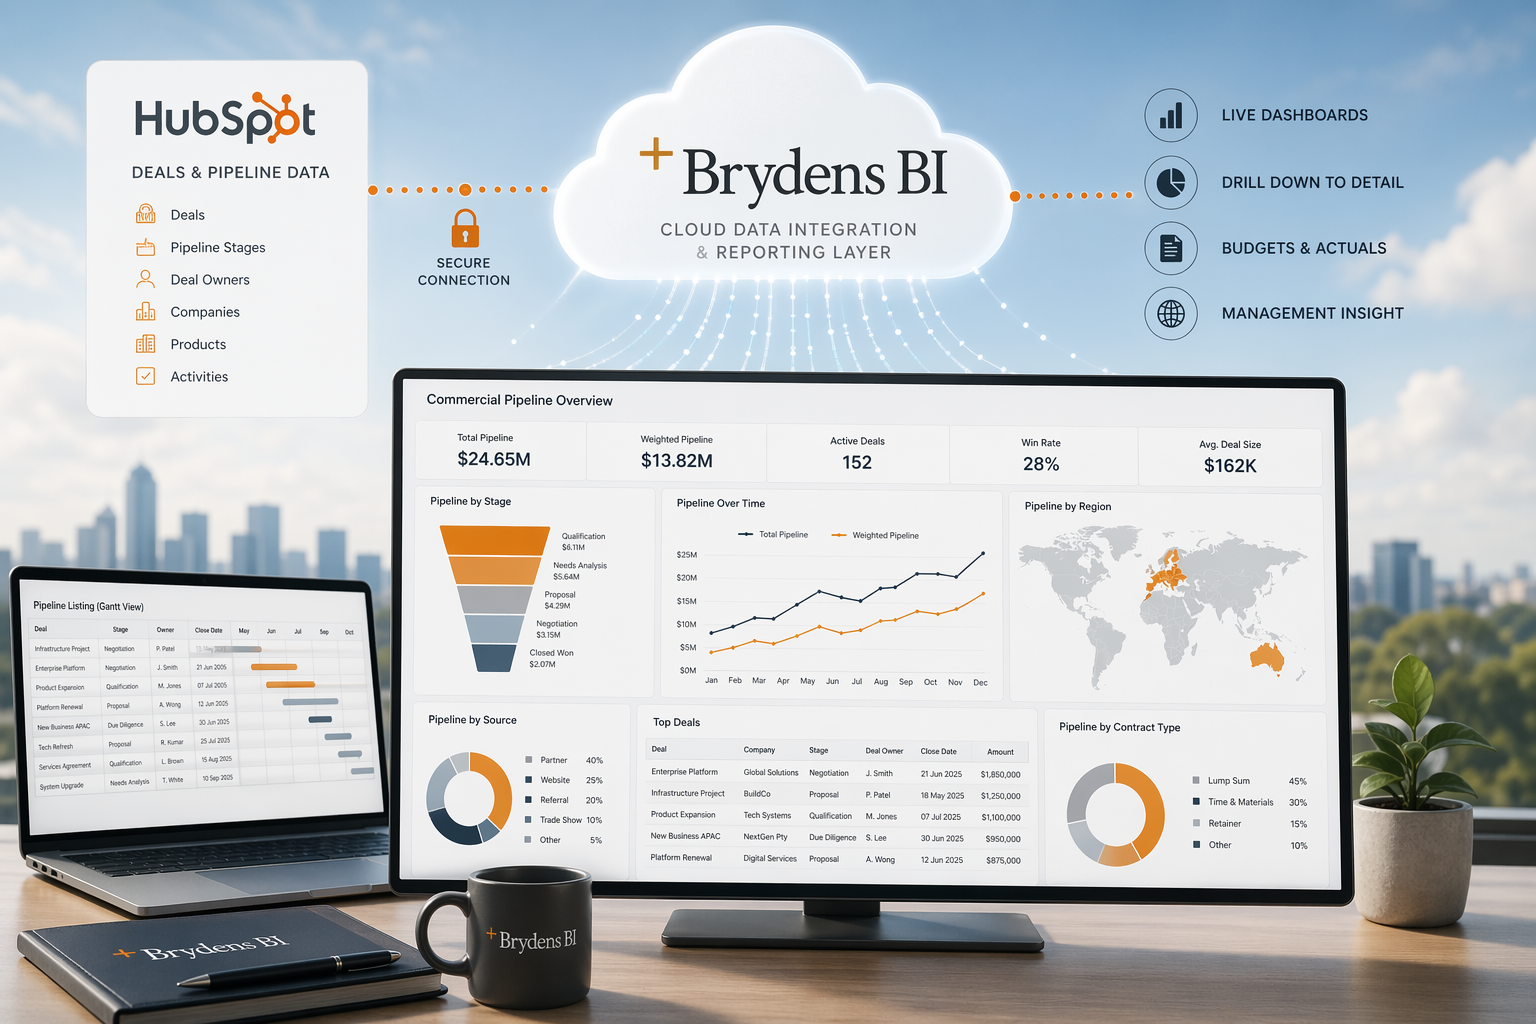
At Brydens BI, we help businesses connect systems like HubSpot into structured reporting environments so leadership teams can access clearer, more timely commercial insight. This includes live dashboards, automated reporting, and analysis that goes well beyond standard CRM views. We typically use Calumo, where we have already linked through to the core ERP(s)/General Ledger(s), HR and similar systems.
Below are two examples of how connected reporting can transform the way businesses use HubSpot data for management reporting, dashboards, and decision-making. You can also see more examples of Brydens BI client work on our Clients page.
Case Study 1: Live pipeline reporting for a major construction business
A large privately held Australian construction company wanted better visibility over its pipeline of potential work. Before the new setup, the team exported data from HubSpot into Excel and maintained a series of smart charts together with a full pipeline listing in a Gantt-style worksheet. The process was survivable and took a few hours, but it had an obvious weakness. In the lead-up to the weekly meeting, staff were still updating HubSpot. By the time the reports were finalised and the meeting began, the information was already out of date.
Brydens BI replaced that lagging process with a live reporting approach. At the start of the meeting, an update is triggered. It takes a couple of minutes, and then the reporting is online, current, and ready for review. Instead of working from static extracts, the team can review live pipeline reporting that is drillable to detailed deal-level information and linked to budgets and actuals outside HubSpot.
The new reporting environment also provides a full pipeline listing report in Gantt format, making it much easier to review potential work in a structured and practical way. Users can filter the reporting by Contract Type, Bid Type, Sector, Pipeline Stage, Location, Go or No Go status, and of course individual deals. That gives management a much more flexible way to assess the pipeline and focus on the opportunities most relevant to planning and commercial review.
For a construction business, that is a meaningful shift. Pipeline reporting does not just support business development. It informs discussions around timing, capacity, budgeting, future workload, and the broader commercial outlook. The value was not simply faster reporting. It was having reporting that stayed aligned with the live state of the business at the point decisions were being made.
Case Study 2: Automated deal reporting for a listed software company
A listed Australian software company with operations across Europe and Australasia needed a more consistent and consolidated approach to deal reporting. Different countries had developed their own reporting methods in Excel, including some strong spreadsheet and Power Query work. But the process took time, the outputs were not fully consistent, and the reporting sat apart from the company’s broader management reporting environment.
That created a practical problem for leadership. There was no single consolidated view of pipeline and deal activity across the business, and it was difficult to bring CRM reporting together with actuals, budgets, and other key financial information in a consistent way.
Brydens BI connected HubSpot into a central reporting environment so that deal and pipeline reporting could be produced in one place, using one approach, with current information always available. Instead of maintaining separate country-based reporting processes, the business could access up-to-date reporting in a unified environment that aligned with the rest of its finance and management reporting.
The reporting now brings through a rich set of commercial dimensions, including currency, deal source, deal type, product line, pipeline stage, deal owner, detailed deal line items, likelihood, company, and of course deal. This makes it far easier to analyse the pipeline in a way that reflects how the business actually operates.
It is also easy for the team to refresh dashboards for different geographic regions, different deal types, and review values by currency. That means leadership can move from manually assembling regional updates to working with a current, consolidated, and far more useful reporting view.
This made the reporting more valuable at an executive level. Pipeline and deal analysis no longer sat in isolated Excel files. It could be viewed alongside actual and budget reporting and incorporated more easily into key management reports and dashboards. The improvement was not just speed. It was consistency, consolidation, and much better visibility across regions.
For a multi-region software business, that kind of reporting capability is important. It gives leadership a more reliable basis for understanding sales activity, comparing regional performance, and linking commercial pipeline information back to the wider reporting framework of the business.
What better HubSpot reporting looks like
These two examples show a common pattern. Businesses often already have the right data in HubSpot, but they do not yet have the reporting structure needed to turn that data into useful management insight.
When HubSpot is connected properly, businesses can:
- Improve pipeline visibility
- Automate deal reporting
- Reduce manual reporting effort
- Create clearer dashboards for leadership
- Analyse opportunities across teams, regions, products, or business units
- Link CRM information with budgets, actuals, and broader management reporting
- Support planning and decision-making with more timely information
This is where Brydens BI adds value. We help businesses move from fragmented CRM reporting to connected, decision-ready reporting.
How Brydens BI helps
Brydens BI works with finance and leadership teams to improve reporting, dashboards, planning, and analysis across the systems that drive business performance. That includes CRM platforms like HubSpot, where commercial data can play a critical role in forecasting, pipeline visibility, and management reporting.
Whether the requirement is live pipeline dashboards, automated deal analysis, or more reliable executive reporting, the goal is the same. Create a clearer view of performance and reduce the manual effort involved in producing it. For more insight into this approach, visit the Brydens BI Insights page.
Final thoughts
If your business uses HubSpot as a core commercial system, but reporting still depends on spreadsheets and manual updates, there is a better way to work.
Connecting HubSpot into a structured reporting environment can improve visibility, strengthen analysis, and give leadership a clearer picture of pipeline and deal activity.
At Brydens BI, we help businesses turn HubSpot data into practical reporting and dashboards that support better decisions.
Looking to improve HubSpot reporting?
Brydens BI helps businesses connect HubSpot into live dashboards, automated reporting, and broader management reporting environments.